How to Prove the Value of Paid Social for Higher Education
In the past, our education client typically focused their efforts on search campaigns vs. social due to search continuously hitting goals. However, when I joined the account, I was determined to prove value by leveraging Paid Social to help hit their goals.
Paid Social Managers understand that it's difficult at times to prove the value of Paid Social, especially when your client is lead driven. Since our client wanted to continue to drive RMIs (Request More Information - a common term in the education industry), the team needed to re-think strategy.
💡 Read the 5 ways higher education marketers are shifting their investments right now.
Step 1: Auditing the Account
The first step that we took was to audit the entire Facebook account, where we noticed a few things right off the bat. For a client whose goals are lead-driven, the campaigns were optimized for brand awareness metrics, such as “Link Clicks” or “Landing Page Views”. Since the client is looking for campaigns to drive RMIs, we knew that we needed to start optimizing for “Leads.”
However, the Facebook “Lead” event was not properly implemented across the landing pages. Another item to add to the list! We hoped that once this was implemented properly and we were officially optimizing toward leads, we would see a significant improvement in performance.
Not sure how to set up and track “Leads” on Facebook? We give you a comprehensive guide to standard and custom event setup here.
It's important to note that for a lot of clients on Facebook, it would make sense to have high to mid-funnel campaign types that are optimized for “Link Clicks” or “Landing Page Views”. However, with this Education client, it would’ve been tough to have separate campaigns for both prospecting and lead gen due to the hundreds of programs and limited budget.
In this case, the conversion action is a relatively high funnel, so we were certain that we could utilize the “Leads” optimization to drive incremental RMIs.
Step 2: Restructuring the Account
One of the tough parts of managing an Education client is that they advertise a boat-load of programs. SO many programs = SO many campaigns to manage. Originally, all of the campaigns were set up by program and had one ad set per campaign.
Instead of structuring the account by program, we decided to structure by college (i.e. College of Arts & Sciences, College of Medicine, etc). Within the college campaign, we would have all of the programs that the client wanted to advertise broken out by ad set. Not only does that make it easier to manage, but we could properly utilize Campaign Budget Optimization (CBO).
With this option, Facebook will optimize our budget based on performance to help us get the most bang for our buck.
Step 3: Auditing the Audiences
Our education client is in the Northeast, so one thing that we started to test was solely targeting Northeast regions vs. the whole US. Our hypothesis here was that the budget would generate more RMIs in states that surround the college and resonate with people who are more likely to recognize the college. By targeting the whole US, it’s likely consumers would not recognize the college when advertised to.
Step 4: Updating Creative
Although we’re still in the process of updating our creative, we wanted to touch on how important it is to continuously audit your creative to make sure it is up-to-date. We started to see our CPCs become more and more expensive, while CTR began to decline as time went on. This is a great indicator that it’s time to refresh your images, headlines, and descriptions because the ads are getting fatigued.
Updating creative on a consistent basis will help to combat ad fatigue, and ultimately improve CPCs and CTR.
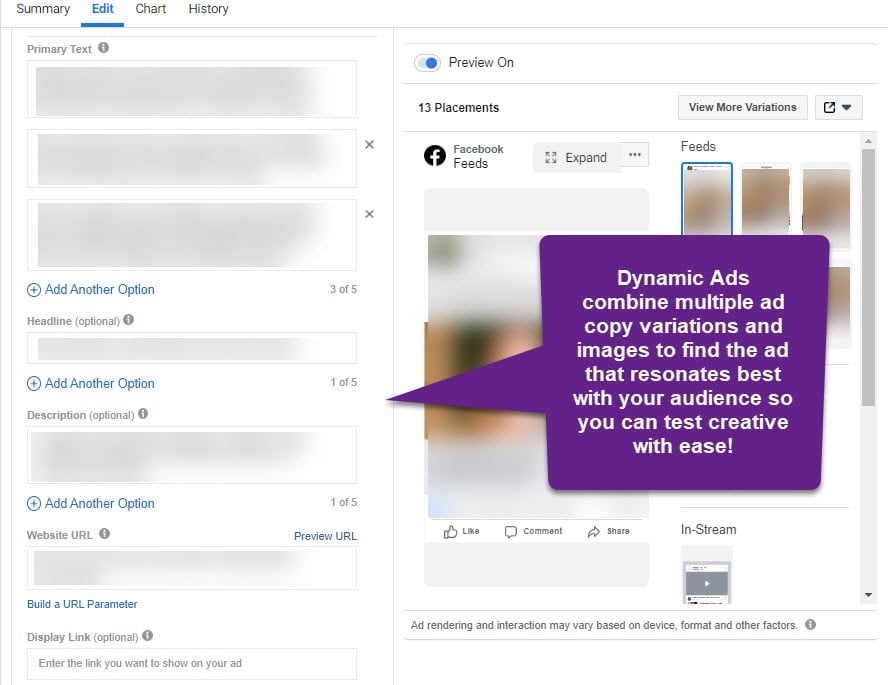
We also started utilizing dynamic creative more, and have not only seen an increase in CTR, but also an increase in leads.

Results
Looking at the past 6 months since restructure implementation, we’ve seen the following performance improvements:
|
Date |
Spend | RMIs | CPL | CVR |
| 6/1/19 - 11/30/19 | $41,377.68 | 36 | $1,149.38 | 0.11% |
| 12/1/19 - 5/31/20 | $117,177.47 | 1,332 | $87.97 | 5.09% |
| % Change | +183% | +3,600% | -92% | +4,527% |
Not too shabby!
Next Steps
At the end of the day, when you need to figure out how to structure an account, always tie it back to your client’s goals. On top of the structure of your account, we recommend using engine automation as much as possible too, because hey, look at the results above. The data speaks for itself!
If you have any questions about the results or how we can help you increase your leads on Facebook, hit up our Paid Social team! We’d love to work with you.


