If you're an ecommerce company who sells products in-stores, estimating foot traffic by location can be tough. However, it can often glean important insight about your customer's journey. Here’s the good news - activating GA 360 and having your Google Ads account linked gives you access to a new feature that helps you analyze exactly that.
Store Visits in Google Analytics helps you analyze how your site activities influence visits to your brick and mortar stores, and see that data within GA. Note that the Store Visits report is currently in beta, and being rolled out to eligible customers gradually.
Why should I track Store Visits in Google Analytics?
First, you can see exactly how on site activities influence visits to your stores, that in itself is invaluable. Additionally, you can analyze which channels and campaigns are driving the most store visits. If your goal is to increase in-store sales then this information alone can help you optimize for store visits. You can then use this data to tailor your ads, spend, and campaigns to optimize for this metric.
How does Google estimate Store Visits?
Google estimates store visits based on data from users who have their Location History turned on. These are anonymous and based off of aggregated data, and the report provides a count of the number of store visits from users who visit your website and then visit your physical store within 30 days.
Store-location data comes from location extensions that are linked from your Google My Business account to your Google Ads account, and then from your Google Ads account to your Analytics property.
Store visit conversions aren’t available to just any advertiser. Specifically, you have to meet the following requirements to be able to access this data (taken from Google’s documentation linked here):
General requirements
- Have Analytics, Google Ads, and Google My Business accounts.
- Have multiple physical store locations in eligible countries. Ask your account representative if store visit conversions are available in your location.
- Have high volumes of store visits data to attribute to website traffic.
Analytics requirements
- Have activated Google signals.
- Have your Analytics property linked to at least one Google Ads account that contains location extensions from Google My Business.
- All Google Ads accounts linked to your Analytics property must have the same location extensions.
Google Ads requirements
- Have at least 90% of your linked locations verified in Google My Business.
- Ensure location extensions are active in your Google Ads account.
How do I set up Store Visits?
If you meet the requirements, you’ll need to do the following:
- Activate Google signals for the Analytics property you’ll want to see store visits in.
- Link the property to at least one Google Ads account that has active location extensions.
- Make sure that all Google Ads accounts with location extensions that are linked to the Analytics property have the same location extensions from Google My Business.
Where can I find the Store Visits report?
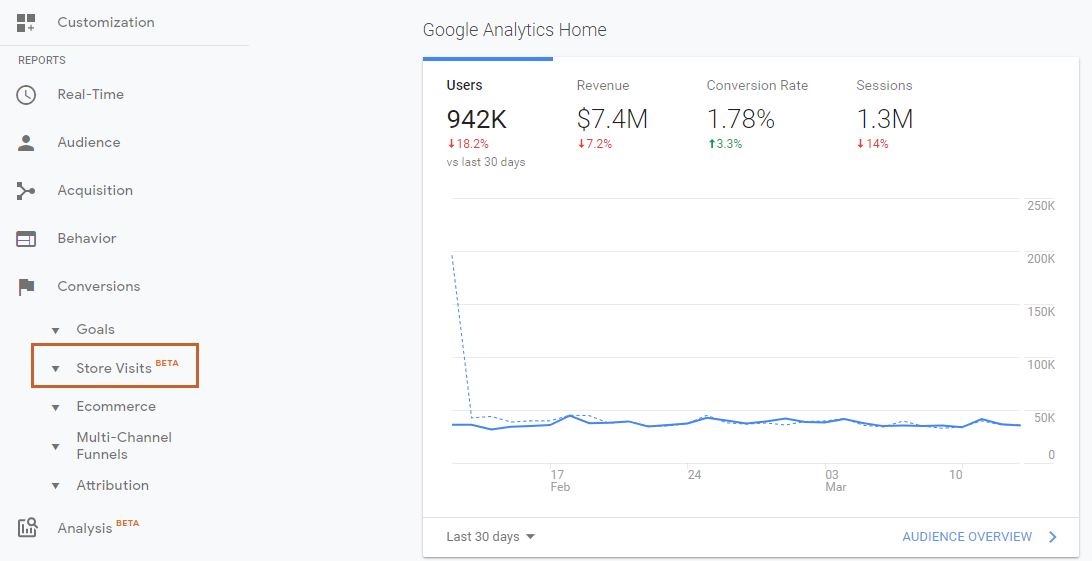
It can take up to three days for the Store Visits report to appear in your Google Analytics, and up to 60 days after you activate Google Signals to start seeing actual visits data. In order to access, go to Conversions > Store Visits. Congratulations, you have now opened up a wealth of information that you can analyze and make decisions based on.

Once you’re in the report, you’ll see there’s three key sections: Overview, Channels, and Location.
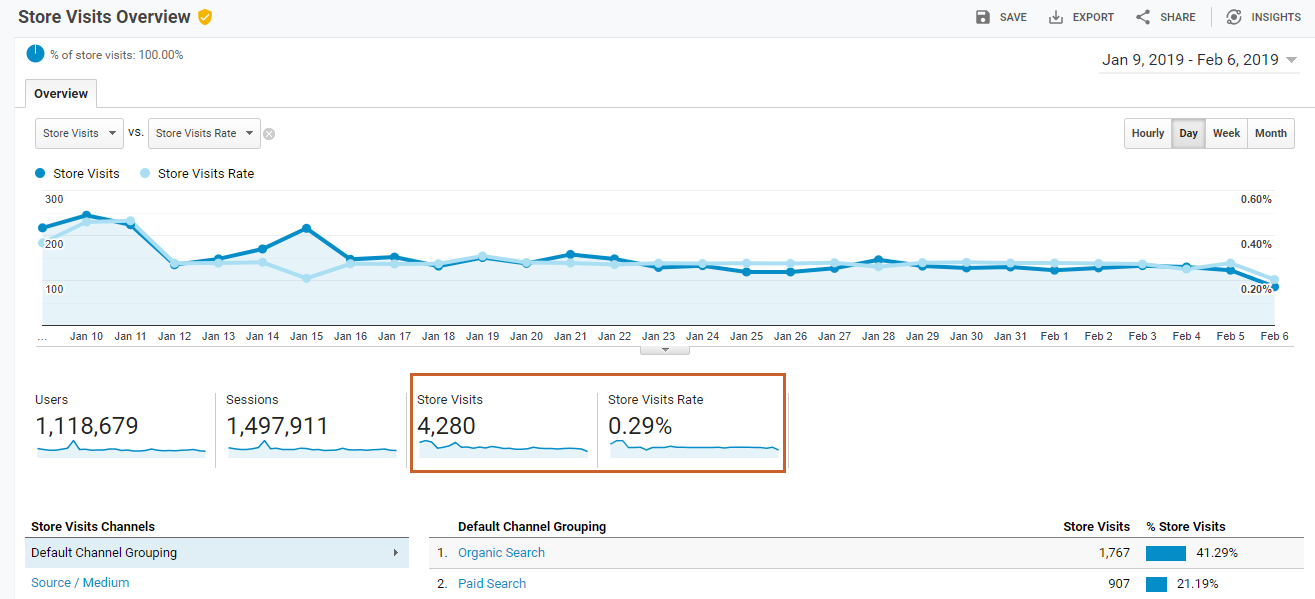
In the Overview section shown below, you can explore:
- Store Visits, defined as the number of visits to the store from users who initiated sessions on the website and then visited the store within 30 days. The number of visits for a given date is reported starting the day after, and may increase for the next 30 days as more users visit the store.
- Store Visit Rate, defined as the number of store visits divided by the number of sessions.

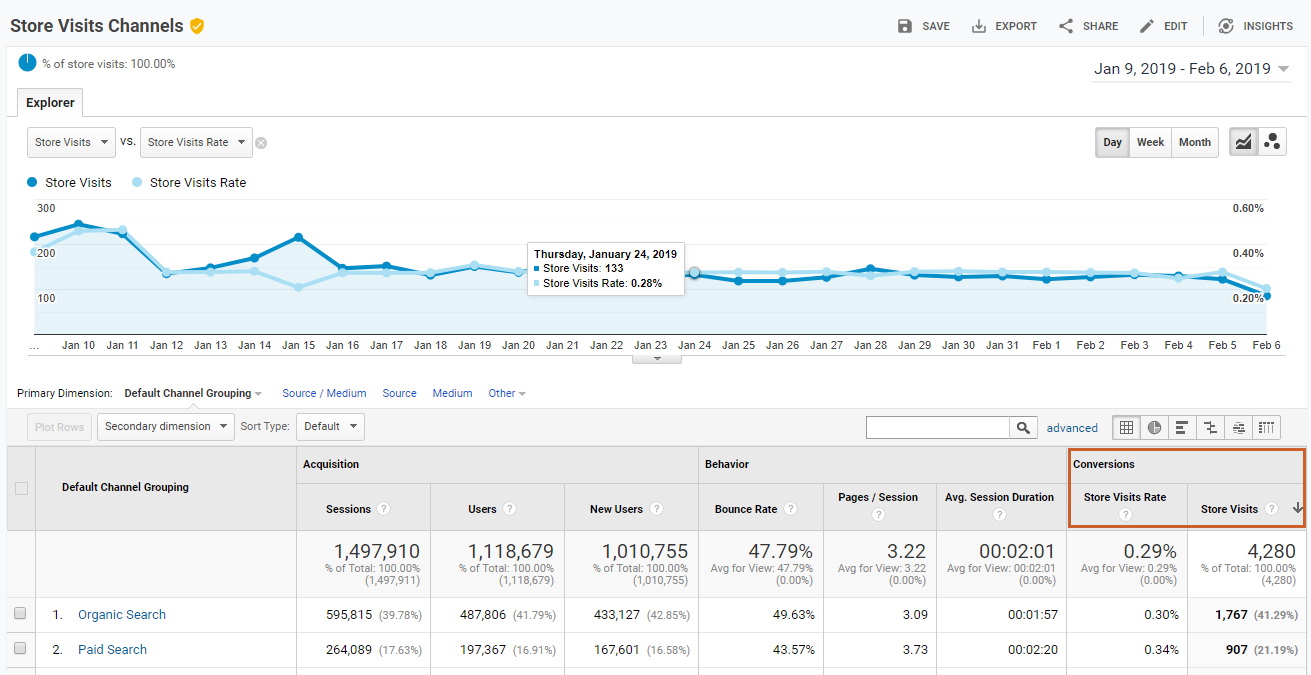
In the Channels report you can actually drill down to the channels and source/mediums and look at how many store visits are coming from each, as well as their respective store visit rates. It’s very similar to how you’d analyze channel performance by your site goals in the Acquisition report.

Lastly, in the Locations report you can analyze where your store visits are coming from, and use the report similar to how you would use the standard Geo report in Google Analytics. 
Here are some best practices by Google, when looking at these reports:
- Pay attention to which region’s users buy the most online, and whether this holds true offline. There might be regional differences in online/offline behavior that should be included in ROAS calculations.
- Observe the impact of your advertising campaigns (across Google Analytics channels) on users actually visiting your physical store locations by leveraging the channel reports.
- Keep track of store-visit rates after marketing invitations or promotions as well as for city level engagement.
Pretty cool, isn’t it? For more insight into how to analyze location data, check out our blog post How to Analyze Location Data for Next Level Geo Analysis!


