We’re in the day and age where in Paid Search, you have to test, test, and test some more. But how do you measure results in a data driven way?
You may have caught our previous post of 3 Ways to Leverage Kenshoo - How We Use It, but I’ll be diving into another feature we love here at Seer: Kenshoo Experiments.
What are Kenshoo Experiments?
Setting up Kenshoo Experiments allow you to create and run tests at scale. The platform provides additional layers of reporting and features built on top of Google Draft & Experiments. The additional features enables you to easily set up, set time frames, and monitor performance in one easy snapshot, utilizing their dedicated Kenshoo Experiments dashboard.
The dashboard supports:
- Bid Strategy Testing
- Landing Page Testing
- Ad Copy Testing
- ...and any custom experiment you could dream up
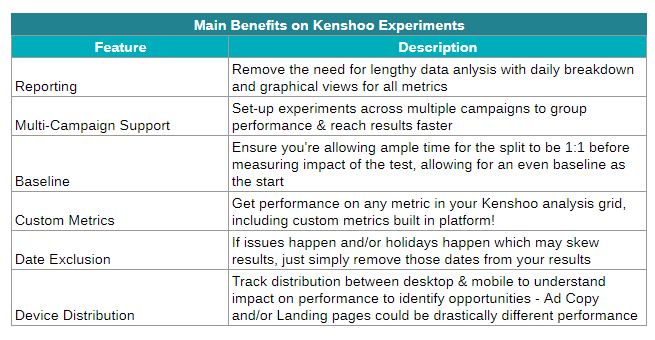
What are the main benefits?
Great, I’m sold… How do I get started!?
Below are the steps to getting you started with experiments:
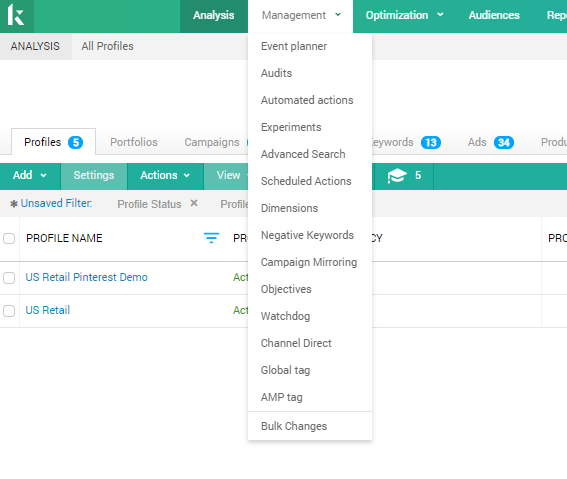
Step 1: Go to “Management” in the top grid & select “Experiments”
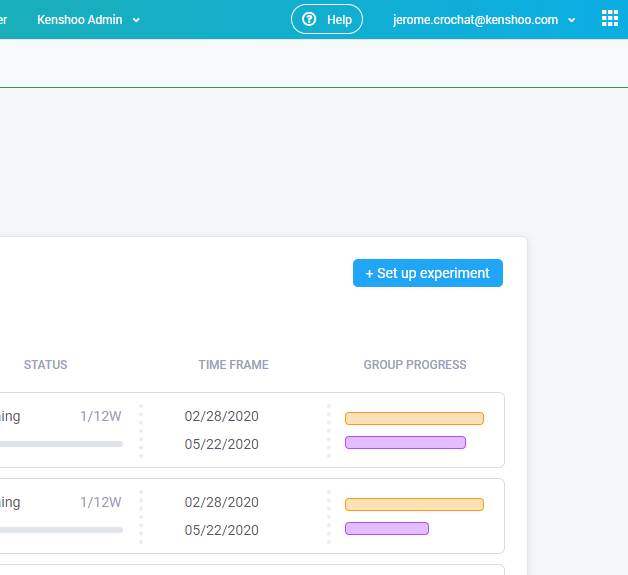
Step 2: Select “+ Set Up Experiment”
Step 3: Select your experiment type and your experiment strategy
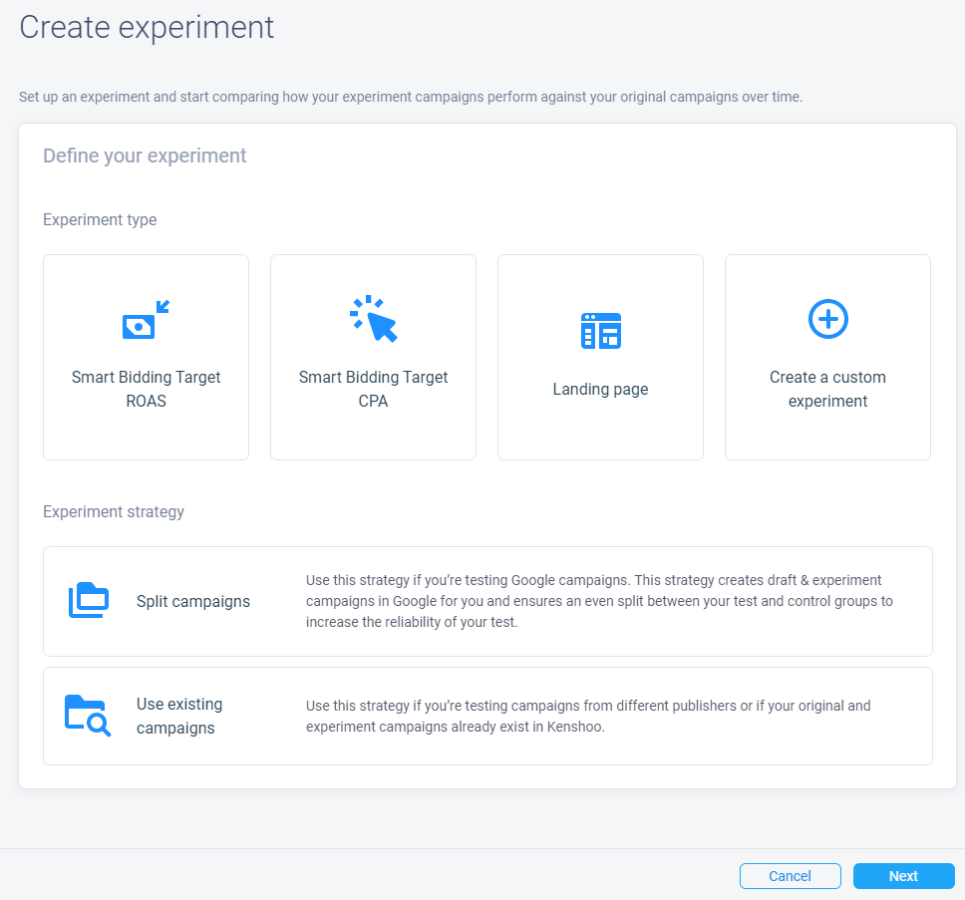
You can go one of two routes - set up the draft in Google Ads or set up the split in Kenshoo. Either way, the results get you to the same set up in both platforms. I’ll be showing you the set up if we were to split the campaigns in Kenshoo.
Step 4: Customize your set up
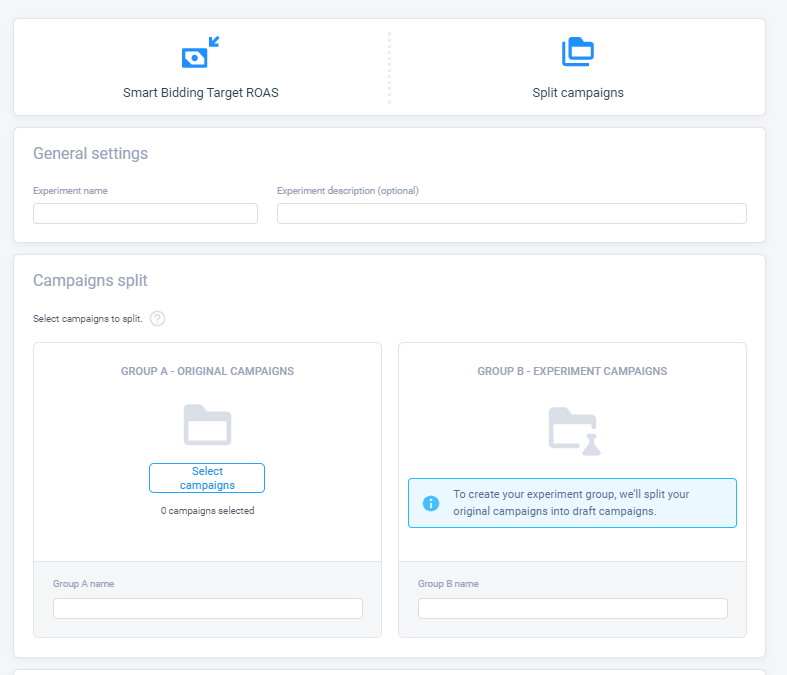
Group A will be your Control set of campaigns, and Group B will be the group of campaigns that have had changes made to them.
💡 Pro Tip: If you’ve set the test up directly in Google, you’ll need to bring in the draft campaigns into Kenshoo before trying to select them into your Group B categorization..
Step 5: Set up your experiment constraints!
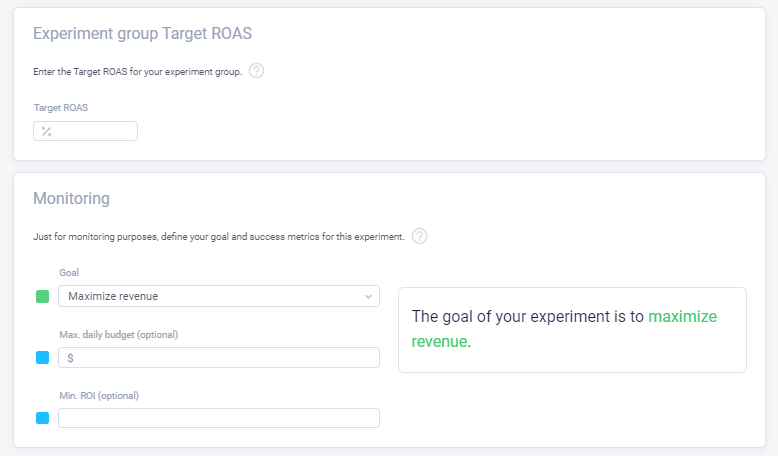
Under Goals, you have two options (for this example: tROAS)
- Maximize Revenue
- Maximize Conversions
💡 Pro Tip: It’s also very important to input your tROAS in here if you’ve selected like me: split the test in Kenshoo. This will be what’s used within your Group B campaign settings..
Max Daily budget & Min ROI are optional inputs, and not necessarily needed if you’re running this alongside Kenshoo Budget Navigator.
Step 6: Define your Baseline, Ramp up & Test time frames
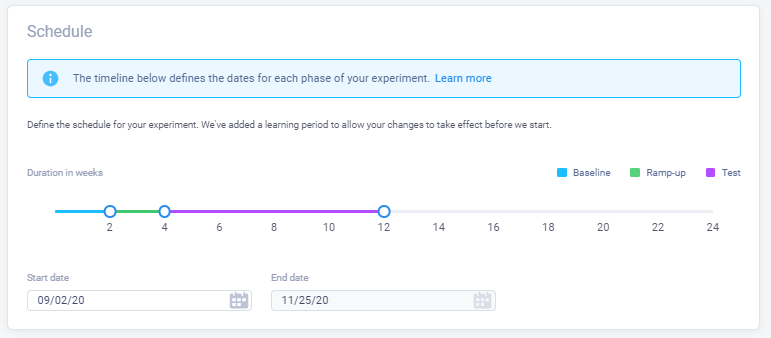
I recommend at least a week for both Baseline and Ramp up before actually measuring results (purple period) - however these fields are adjustable.
The end date will change based on the duration of the “Test” period defined with the purple line.
Lastly, you will review the Summary of your experiment set up and check off the “Agreement” section.
The “Agreement” options are just giving Kenshoo / Google permission to set up this experiment for you and is not included if you do not go the Kenshoo split route.
Evaluating Your Results
Once you’re all set up with your experiment, it’s time to start measuring impact! Kenshoo makes looking into results of your grouped campaigns SO easy… easy enough all you have to do is grab a screenshot to give performance updates to your client.
Under the general “Experiment” view, you’ll see your experiment set up with whatever you decided to call it:
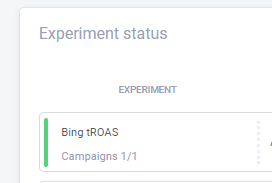
You can click the box and it’ll open up to your full results breakdown that I had mentioned earlier in this post. Here’s an example of what that will look like:

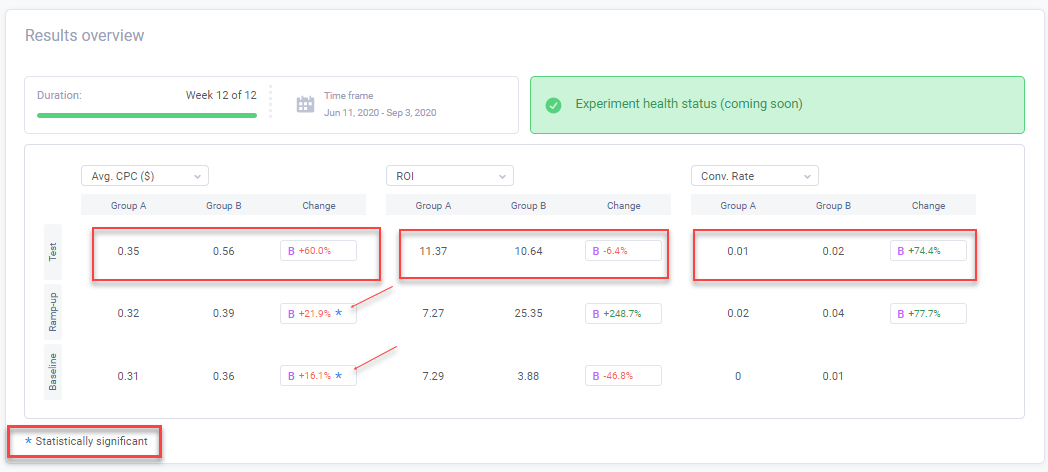
In this example, you can see:
- Out of all metrics selected, only Avg. CPC is statistically significant - this is important when understanding if you should expand your test period out if CPC is ultimately not your main goal.
- In 2 of the 3 categories selected (many more to choose based on your clients goal!) the Control grouping is performing stronger. However, the CVR is stronger in the Test grouping.
- This is why it’s very important to set expectations on what is the main goal for this test based on the type of test you’re running. Set expectations early, save yourself the headache in evaluating later.
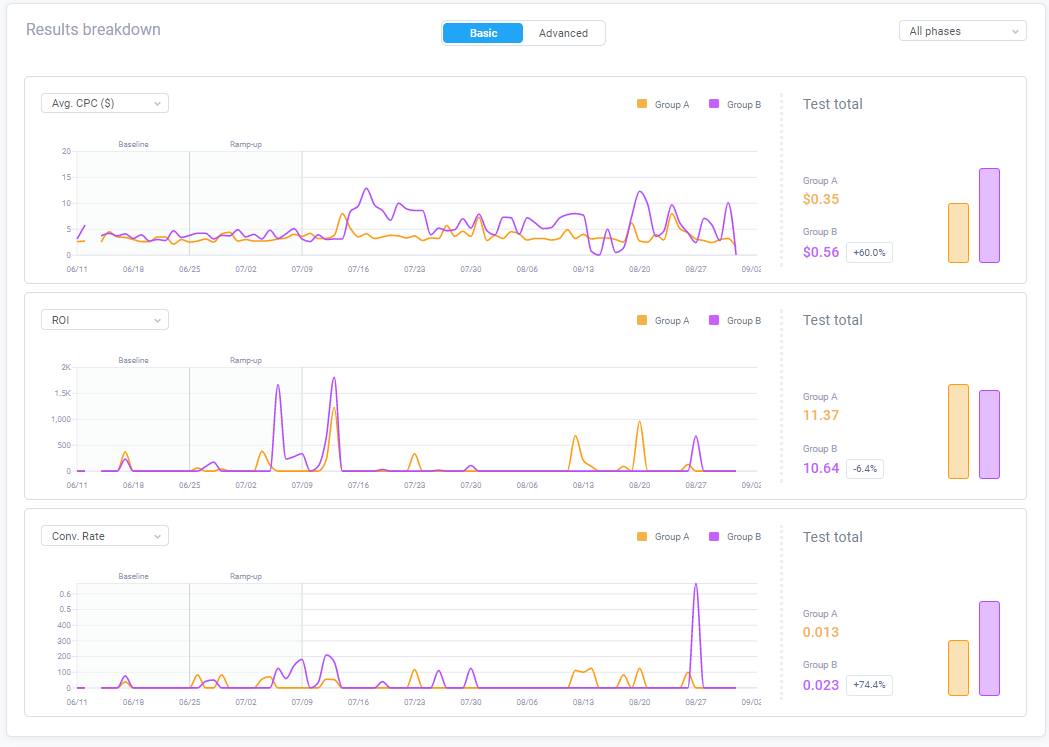
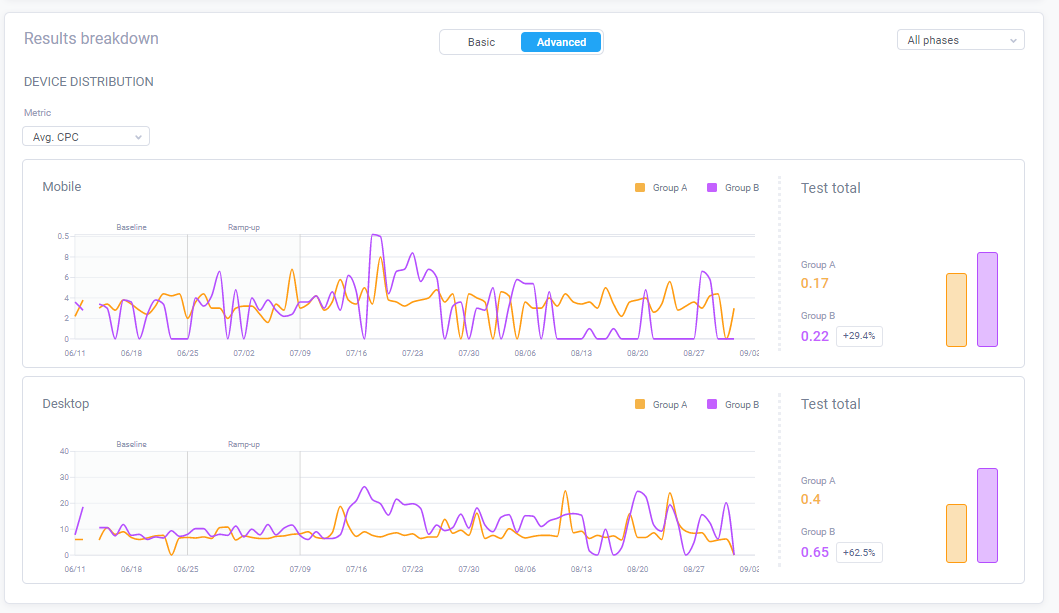
To explore even further, you can dig into your by day metrics, and your device breakdown which are shown below:
I will end with saying, Kenshoo Experiments are ever-evolving so this is just the tip of the iceberg on what they’re doing over there at Kenshoo to make analyzing data super easy and visual for us and/or our clients. Happy analyzing ya data nerds :)

