Table of Contents
- What is data sampling?
- What is the best solution for Google Analytics data sampling?
- How do you know if your data is sampled in Google Analytics reports?
- When does Google Analytics sample data?
- What is the query limit for Google Analytics reports?
- What does (other) mean in Google Analytics reports?
- How does (other) and high cardinality affect my reports?
- What are the sampling thresholds for Google Analytics?
- How to check your hits in Google Analytics
- How can you solve for data sampling?
- Can third party solutions solve Google Analytics data sampling?
- Google Analytics data sampling 'solutions' we DO NOT recommend
What is Data Sampling?
DATA SAMPLING is a process used to analyze a subset of data, in order to try and more quickly understand the entire data set.
Let’s say my two sons dumped out 10,000 lego pieces onto their bedroom floor, and instead of cleaning it, I wanted to determine how many red lego pieces there were.
Assuming that the legos are all mixed up, I could isolate a small section of the room, and count say 1,000 pieces. If there were 200 red pieces in that sample (subset) I could then make an assumption that there were about 2,000 total red pieces in the room.
DATA SAMPLING IS ESTIMATING RATHER THAN COUNTING.
Rather than force you to spend hours sifting through proverbial legos, you can look at just a small set, and make some assumptions about the larger.
The benefits and drawbacks here should be obvious. It’s significantly quicker, but it sacrifices accuracy. If you have an uneven distribution and the density of red legos is different across the room, then your sample might not account for it, and your estimation of total red legos, could be way off. Or if you count too small a number, say 100 of the pieces rather than 1,000 then your chances of accuracy also diminish.
What is the Best Solution for Google Analytics Data Sampling?
If you want to skip the learning, and get to the best solution for data sampling in Google Analytics, then look no further. The answer is to purchase Google Analytics 360. Seer Interactive is a reseller of Google Analytics 360, and we can assist you in getting GA 360, and supporting you with the product.
Not sure if upgrading is right for you? Read more about the differences in what you get with GA 360 and the Google Marketing Platform from our Analytics blog.
How Do You Know if Your Data is Sampled in Google Analytics Reports?


Sampling in Google Analytics follows the general outline laid out above, but does it in different ways depending on which section of Google Analytics you’re in, what the data is doing, whether you have GA 360, and more.
In this guide, you’ll learn about all of the ways that Google Analytics can sample your data. We'll also show you what you can do about it when sampling is impacting your ability to analyze your data.
While the exact sampling algorithm is a mystery, we know that it samples proportionally to the daily distribution of the sessions within the date range you’re using.
If you are looking at a 5 day period, and sessions are sampled at 25%, then it would take a 25% sample from each day. Each query varies as sampling is produced ad-hoc, and the rate can vary from query to query depending on the sessions included, and the date range applied.
When Does Google Analytics Sample Data?
In general, Google Analytics samples on Sessions, rather than Users. Keep in mind also, that Users really means “Browsers”. Even though there have been strides in Cross-Device attribution in recent years, more often than not, if you visit a site from your laptop once, and then from your phone once, you will be counted as 2 users (and 2 sessions).
- Say 1 person visits your site 100 times (from 1 device), that's 100 sessions.
- If 100 people visit your site 1 time each, it’s 100 sessions.
- Now if 5,000,000 people visit your site an average of 2.3 times each, you will have about 11,500,000 sessions (and 5,000,000 users).
Taking that last case, your Google Analytics data would use the 11,500,000 sessions and sample based on those numbers. Unsure of the difference between sessions vs users in Google Analytics? Read our post on why Google Analytics scope matters.
Default Reports in Google Analytics are Never Sampled*
Something many people forget (or don’t know) is that Default Reports, also sometimes called Standard Reports are never sampled in Google Analytics.
Google Analytics first captures all sessions in a Visits Table which stores the raw data of each session. It then creates Processed Tables (also known as Aggregated Tables) of that data, to give as many users as possible access to quick unsampled reporting, even with the free product, of your key data, in the form of the Default Reports.
Essentially anything on the left hand side of the Google Analytics navigation, that by default is in your Google Analytics is a Default Report. If you navigate to your Acquisition reports to pull up the Source/Medium report, it should, as a Default Report, be unsampled.
There are a couple major exceptions here. One is if you use the UTM Override feature, there can be sampling in some of the Google Ads reports. This is not a common feature to use, so it won’t affect most users. Google explains how to Tag Your Google Ads Final URLs here.
The other exception is when people essentially use the Google Analytics interface in pretty much any way to analyze the data. Here are some of the common things that you might do to modify a Default Report, which would trigger sampling:
- Apply an Advanced Segment
- Add a Secondary Dimension
- Create or Use a Custom Report
- Make a Date Comparison
So while you can look at your Source/Medium report and see how many sessions came from an organic Google search, if you wanted to see how many of those searches came from a mobile device, by adding a secondary dimension, you would trigger sampling, and that Default Report would no longer be unsampled.
Get a full rundown on how to create custom reports in Google Analytics here.
What is the Query Limit for Google Analytics Reports?
Ultimately, no matter what, for any date range, queries in Google Analytics will return a maximum of 1 million rows for a report. This is a built-in system limit that, If a query were to return more than that, it will aggregate all excess rows into “(other)” as well.
What does (other) mean in Google Analytics reports?
When you see (other) in your Google Analytics reports, it’s another form of sampling that relates mostly to what are called “high cardinality dimensions”. Dimensions in Google Analytics are the aspects of a thing (where a user is from, what device they are using, what pages they viewed) where Metrics are measures of what those aspect did (sessions, pageviews, conversions, etc).
The cardinality of a dimension is a fancy way of saying ‘how many values are there’. For the Mobile Device dimension the cardinality is 2 with the values being “yes” or “no”. If you have a website with 1,300 Pages listed in your Behavior report, then the cardinality of that dimension is significantly higher than that of the Mobile Device dimension.
Google Analytics has cardinality limits. If you exceed these limits, i.e. you send more unique values for a dimension than the limit, that new value gets consolidated into a single row of data labeled (other).
If you are looking at a single day, Google Analytics will reference a Daily Processed Table of your data (created for a single day). If you exceed 50,000 values (ie rows) with the free product, or 75,000 rows with Google Analytics 360, your additional rows will roll up into the “(other)” label.
In order to speed up reports with longer date ranges, Google Analytics also creates Multi-Day Processed Tables which contain 4 days worth of data. These are created from the Daily Processed tables. The limits are increased here to 100,000 rows for the free product, and 150,000 rows for Google Analytics 360. Like before, anything over these limits will be rolled up into a value of “(other)”.
How does (other) and High Cardinality Affect My Reports
The higher the cardinality the more information could be lost. Often high cardinality stems not from “naturally” but “artificially” occurring reasons. For instance, a website might only have 1,000 pages, but it appends a parameter to each page with a unique user or session code. Then if they have 1 million users, each with a unique parameter, which isn’t filtered out of the Pages dimension, each page would be a different row.
- /hats?user=1
- /hats?user=2
- /hats?user=3
After the first 50,000 pageviews, with the free product, each and every pageview would be bucketed into “(other)”. If this were to occur by 7am in the morning, every pageview after that point for the entire day would become (other) as well. What gets placed into (other) would not be sampled using an algorithm like the general sampling method. It is a first in, first out method.
What are the Sampling Thresholds for Google Analytics?
The sampling thresholds (ie limits) for Google Analytics differs whether you are using the free product, or have purchased Google Analytics 360.
If you are using the free product, sampling will kick in within the Google Analytics interface at approximately 500,000 sessions within the date range you are querying. This sampling occurs at the Property level. By sampling the property, View level filters do not impact the sample size.
If you are using Google Analytics 360, sampling will kick in at 100 million sessions, and the sampling occurs at the View level. Because of this View level filters DO impact the sample size.
Beyond the difference of 500,000 vs 100 million sessions, a key benefit of Google Analytics 360 here, is to have the sampling occurring at the View level. It allows a user to create View level filters to reduce down the total “overhead” of sessions that will be sampled.
Example:
- A company has 5 different websites which loosely interrelate.
- They have a single Google Analytics Property on all 5 websites with a total traffic of 500 million sessions per month.
- They have each website under a separate View within that single Property.
- Looking at the view for Website A, which receives 40 million sessions per month, doing a monthly analysis, the sample would occur at the PROPERTY level of 500 million sessions.
- Immediately causing a 0.01% sample (or worse) for looking month over month. It would be completely useless.
Counter Example:
- Same company purchases and sets up Google Analytics 360.
- They now sample on the View level, and while looking at the Website A filtered View they are able to look at month over month without any sampling.
- The sampling first occurs at the View level, so is only considering 40 million sessions, rather than 500 million.
- Month over Month is considering 80 million sessions, rather than 1 Billion.
Are you leveraging Google Analytics view filters for better reporting? Learn more here.
How to Check Your Hits in Google Analytics
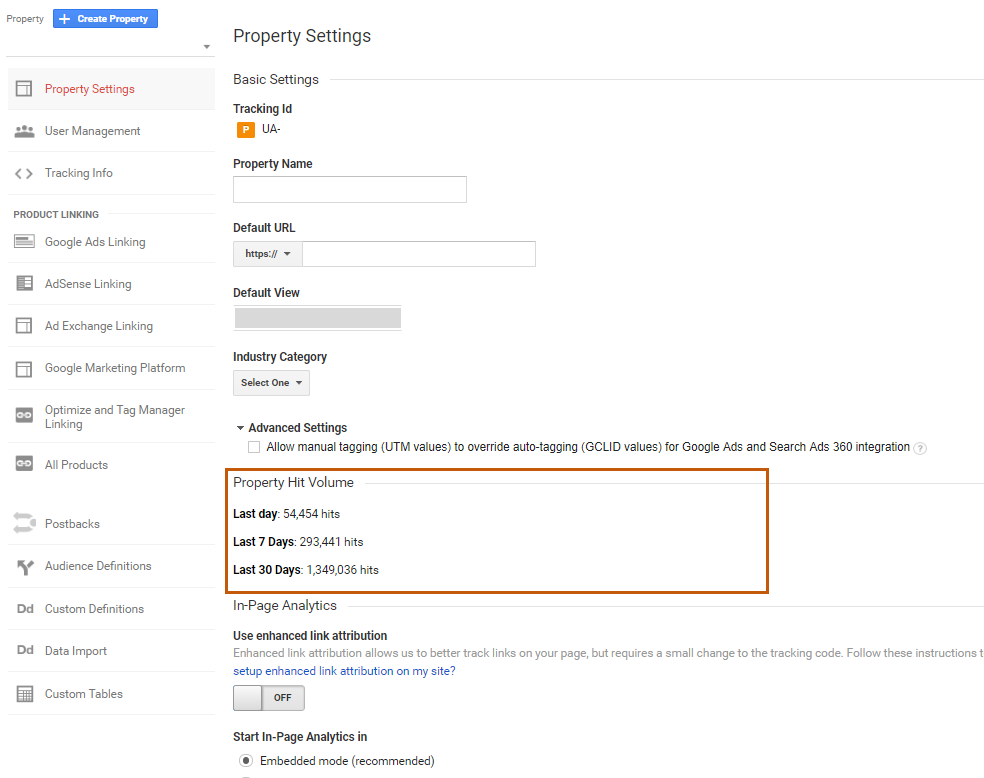
Admin & Property Property Settings
To find out your hits for the last 7 days and 30 days, go to Admin > Property > Property Settings. You should be able to see the hit volume once you scroll down.
Does Google Analytics Sampling Affect Data Studio?
Data Studio uses the same sampling behavior as Google Analytics. This means that if a chart in Data Studio creates an ad hoc request for data in Google Analytics, standard sampling rules will come into play. You can't change the Google Analytics sampling rate in Data Studio, but you can opt to "Show Sampling" with the sampling indicator.
Are you an avid Data Studio user and want to know how to avoid Data Studio sampling? Read our post here.
Does Google Analytics Sampling Affect the API?
The Core Reporting API is sampled in specific cases, for both standard GA and GA 360 users. Google Analytics calculates certain combinations of dimensions and metrics on the fly. To return the data in a reasonable time, Google Analytics may only process a sample of the data.
You can use the Sampling Level (samplingLevel) parameter to specify the sampling level to use for a request in the API. If this parameter isn’t supplied, then the Default sampling level is used.
Below are the sampling levels available for query:
- DEFAULT — Returns response with a sample size that balances speed and accuracy.
- FASTER — Returns a fast response with a smaller sample size.
- HIGHER_PRECISION — Returns a more accurate response using a large sample size, but this may result in the response being slower. Note that sampling may still appear with this setting, and that higher precision does not equal total precision.
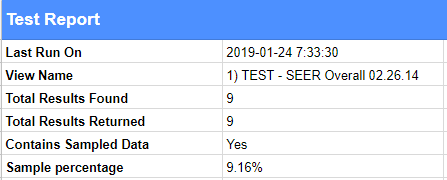
If you want to see if your data is sampled or not, there’s a field within the report called “Contains Sampled Data” that has a value of “Yes” when the data is sampled (example below). Notice how there’s a field called “Sample Percentage” below it - this field shows the percentage of sessions that were used for the query, and the extent of sampling you’re running into.
How do Multi-Channel Funnel and Attribution Reports Sample in Google Analytics?
An exception to the above are the Multi-Channel Funnel and Attribution reports. These always sample at the View level for everyone, and View level filters do impact their sample size as well. Like Default Reports, MCF reports always start out unsampled, unless you modify them in some way (by changing the lookback window, included conversions, adding a segment, secondary dimension, etc.) If you do modify the report, it will return a max sample of 1 million sessions regardless of whether you are free or GA 360.
How does the Flow Visualization Report Sample in Google Analytics?
The Flow Visualization Report always samples at a max of 100,000 sessions for the date range period you are considering. This causes the Flow Visualization Report to consistently be more sampled, and more inaccurate, than any other section of your Google Analytics data.
In particular Entrance, Exit, and Conversion Rates will likely be different from other Default Reports, which originate from different sample sets.
What is the Conversion Paths Limit in Google Analytics?
There is a limit of 200k unique conversion paths in any report. Additional conversion paths will roll up into (other).
How Can You Solve for Data Sampling?
Custom Tables in Google Analytics 360
Custom Tables are a powerful way that a Google Analytics 360 user can overcome both high cardinality, as well as standard sampling in Google Analytics. Essentially it’s a way that you can designate to Google Analytics additional metrics, dimensions, segments, and filters to process as unsampled on a daily basis much like the Processed/Aggregated Tables which create the Default Reports.
Once a Custom Table is created, any report that also matches a subset of that Custom Table will be able to access it for fast unsampled data just as a Default Report uses the Processed Tables. This includes when you are using the API to access the data.
One major difference between a Custom Table over a Processed Table, is that the limit on the number of unique rolls stored per day is increased to 1 million from 75k. Anything over 1 million rows within a Custom Table, will then be aggregated into (other).
For example, if you regularly look at a report with City as the primary dimension, and Browser as the secondary dimension, looking at sessions, pageviews, etc, and get sampling (because of the use of the secondary dimension), you could make a Custom Table with those dimensions and metrics, and then you would be able to see it in the Default Reports unsampled (even with the secondary dimension applied).
If you like using lots of parameters in your Page URLs, and want to keep them in your reports, you can create a Custom Table with that dimension and associated metrics, and then be able to see up to 1 million unique rows in the Default Report, rather than 75,000.
Not all metrics or dimensions can be included in these Custom Tables, and not all reports can benefit from them. User based segments cannot be included in Custom Tables. In addition the follow reports can’t use them at all: Flow Visualization, Search Engine Optimization, Multi-Channel Funnels, and Attribution.
Once created, it can take up to 2 days to see the unsampled data. Ultimate Google Analytics will populate 30 days of historical data prior to the creation of the Custom Table, and while usually that will be in place also within 2 days, it could take up to 40 days to populate.
It’s also recommend that if you are leveraging Custom Tables with the Google Analytics API, to match the API queries exactly to your Custom Table definitions, to avoid Google Analytics from reverting to the standard aggregate table data, rather than the Custom Table. Each property is limited to 100 Custom Tables.
You can read a whole lot more about Custom Tables right here on our GA 360 dedicated blog.
Unsampled Reports in Google Analytics 360
With GA 360, if you go into your reports (for instance, go to Audience > Overview), barring specific situations using segments you should generally be able to view unsampled data.
However, there are some limits to unsampled data, even in GA 360. Analytics 360 does have a threshold for sampling - it’s just significantly higher than it is for standard GA - 100M sessions at the view level for the date range you are using. 360 thresholds can also very according to how specific queries are configured.
If you run into sampling within the GA 360 interface given your high volume of traffic, however, you can still view unsampled data using Unsampled Reports.
To create an Unsampled Report you have to export a standard report (that has sampling as an Unsampled Report). For example, if you’re running into sampling in your Audience Overview report, you can export it as an Unsampled Report, and GA 360 will automatically start to process your report unsampled for you to access.

You can view the report in the interface, as well as export the data, and schedule how often it should run. Note that you have the options to export your data as CSV, TSV, or a TSV for Excel file.
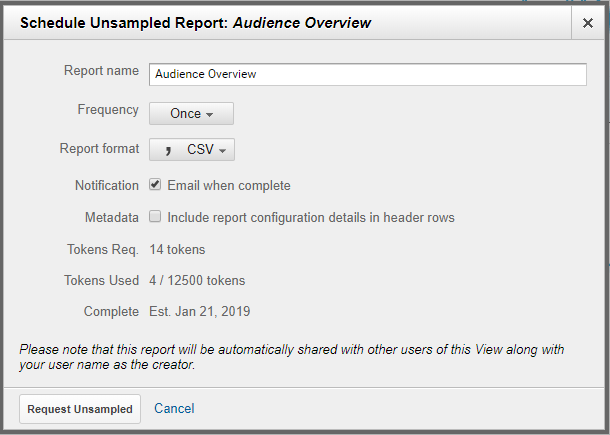
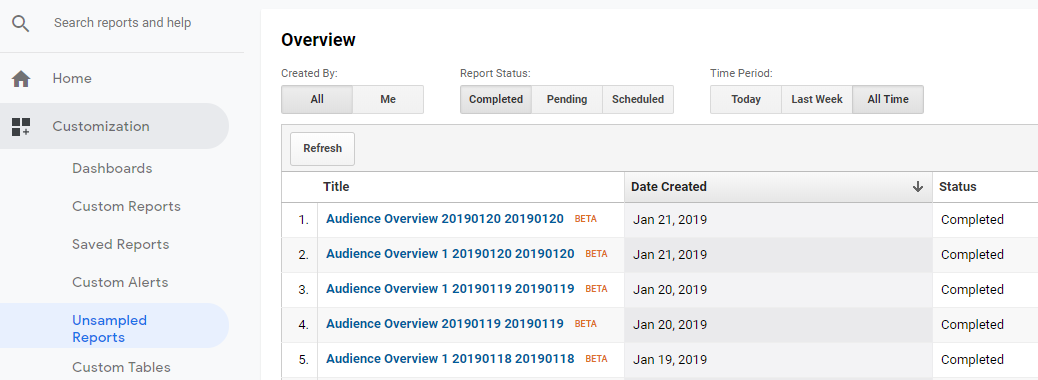
To view an Unsampled Report within the interface, go to Customization > Unsampled Reports to view your Unsampled Report.
Has your company or business just recently upgraded to GA 360 and aren't yet familiar with these features? Read about Unsampled Reporting
Can Third-Party Solutions Solve Google Analytics Data Sampling?
While there are some solutions to solve the problem of sampling, it’s time-consuming and very much a manual process. Below are some ways to use third-party tools to address sampling - to a certain extent.
- The first way to get unsampled data is by selecting shorter date ranges, even if that means pulling data multiple times. If you want more details on how to do this, and analyze the data in Excel, click on over to our post How to Avoid Google Analytics Data Sampling Using Excel.
- Unsampler can be used for ad hoc pulls of unsampled data. The methodology for this is similar to the one above. Behind the scenes, the tools break down your data into smaller time frames and then aggregates it back into one range – mostly avoiding sampling (see note below about User level data). Read more on how to here.
- For Google Sheets enthusiasts, you can use the API to manually pull GA data into separate time ranges and then use formulas or pivot tables to put it all back together again (just as Unsampler does behind the scenes).
- Lastly, you can use a data warehouse. With data warehouse automation, you can essentially limit the time it takes analysts to extract, transfer, and load data in order to report and analyze it. This heavy-duty solution is ideal for those who understand the importance of cutting down the time and effort required by humans to report and analyze on recurring data sets. While these solutions tend to be more costly, BigQuery offers a cost-effective approach to querying data for GA 360 users. Under the GA 360 integration, users are given a usage credit of up to $500 a month for free. It is rare for GA 360 customers to exceed this credit.
Now, aggregating data from multiple data pulls becomes difficult if you’re performing analysis at the user level. First, a refresher:
| In Google Analytics, a SESSION groups the component hits throughout one viewing session. This will track a full “session” as a time a user enters the site until they leave, with all subsequent hits within it. Comparatively, USER looks at the data in terms of a user’s aggregated sessions and hits. |
When pulling data in batches from the API, user-level metrics cannot be accurate since to analyze user behavior you need to look at the data over time. This means you cannot pull small date ranges and then stitch them back together if you're aggregating user dimensions/metrics.
Refer to our blog post on Google Analytics Scope for more on this.
How to Ensure Google Analytics Data Accuracy
DO: Use Standard Reports as Much as Possible
Standard reports (listed in the left pane under Audience, Acquisition, Behavior, and Conversions) are unsampled in both Analytics Standard and Analytics 360. However, if you’re using segments or a secondary dimension - that’s when you’ll run into sampling. As long as you avoid using segments/secondary dimensions in a GA standard report you should not be running into sampling. One note here is if you’re using the utm override feature in GA then you may run into sampling in some of your Google Ads reports.
DO: Try Faster Response vs Greater Precision
When a report is sampled, you can change the sample size to adjust reporting precision and speed. There are two options to do this:
- Greater precision: uses the maximum sample size possible to give you results that are the most precise representation of your full data set
- Faster response: uses a smaller sampling size to give you faster results
Switching your preference to Greater Precision will result in a more precise data pull, although this may take longer.
DO: Avoid Sampling in the First Place
One way to get around sampling is not having it occur in the first place. Sounds like a great utopian data dream, you might say - let’s see how we can best get there in some situations. Here are a few ways to avoid sampling in the first place:
- Only pull the standard GA reports over smaller time frames - i.e. the reports naturally available in the interface (Source / Medium, Landing Page, etc.).
- REMEMBER THIS: By default these reports cannot sample (at normal hit volume), because they are pre-processed by Google before the data is retrieved. Where you run into trouble is when you start adding secondary dimensions, segments, and extending the data range.
- As mentioned above, you can set-up Unsampled Reports, which cannot sample by default.
- If you store your data in BigQuery, this is inherently not sampled as well.
Avoiding sampling in the first place can be the difference between getting the full picture of your data, and having to guess at total performance based on only a small percent of your data.
Think of it this way - if your data was a book or a song, and you only had 75 or 50 or 25% of it at once (in a random order mind you), would you be able to tell who all the characters in the story were or what artist the music is from? If you wouldn’t feel confident about making these assumptions and extrapolations with a book or a song, why would you feel fine in doing the same with your data?
DO: Run Reports with Shorter Time Frames
As mentioned earlier, you run into sampling for Analytics Standard at 500k sessions at the property level for the date range you are using. If you use a shorter date range you might avoid sampling if your sessions for that time period fall below the 500k threshold.
That being said, a major drawback of this is that you’re losing out on the power of analysis over a longer timeline. Also, running multiple data pulls and aggregating the data after the fact is a cumbersome process.
DO: Create a Filtered View vs Advanced Segment
If you absolutely do need to use a segment, for instance, to analyze performance of users who come to the site via Organic Search, you can also create a new view with a view level filter that filters in Organic data only. This will let you use this new view, which should have significantly less sessions as it’s filtered for specific data, to analyze data unsampled. Note that you might still run into sampling if you try to use segments or secondary dimensions within this new view.
The one major drawback of this method is that Views start collecting data from the date that they’re created, so you wouldn’t be able to access historical data in this new view.
DO: Get Creative with Google Tag Manager
Another thing you could do is use Google Tag Manager (GTM) strategically with custom events. This can help you avoid incrementing too many hits.
For instance, if you’re always using Page as a secondary dimension which then leads to sampling, you could pull in the Page Path as the Event Label of majority of your events so you wouldn’t have to use the secondary dimension of Page within the report (thereby resulting in sampling).
Additionally, if there are instances where specific pages are reloaded several times, incrementing hits, you could set the page to load just once and an event to fire strategically after the 10th load, for instance.
Google Analytics Data Sampling 'Solutions' We DO NOT Recommend
While there are some things we do recommend to do to get around sampling, there are some that don’t make any sense at all, or won’t make any sense depending on your business. I want to stress the number one thing we don’t recommend, if it isn’t already clear above:
DO NOT: Use Sampled Data to Make Decisions
This should come as no surprise based on the content above, but if you are using sampled data, you are setting yourself up for confusion, misinterpretation, and in the worst case, poor decisions that could negatively impact your marketing distribution, content or campaign creation, or even your bottom line results. With the above options to get around sampling, we hope that you can at least have some option to not have to resort to using sampled data.
DO NOT: Track Hits via Different Google Analytics Properties
While splitting your hit account across multiple properties may seem like a novel idea to get around sampling, in most cases this is not worth the hassle that it will bring.
Tracking across multiple properties really only makes sense if you have very disconnected sites, with completely different user experiences, tracking needs, and data needs.
A far more simple solution is to create additional Google Analytics views for unique data needs within a single property. That’s going to be a lot easier then needing to uproot and/or complicate your GTM set-ups for multiple properties as well.
Did you know another great reason to upgrade to GA 360 is automatic roll-up reporting?
DO NOT: Lower Sample Rate via GTM Fields to Set
Google does give you the option to lower your sample rate via a field to set, which would be most simply done via your GA Settings variable in GTM. However, we don’t recommend this approach (unless in the most extreme traffic examples), as this inherently takes the opportunity to deal with sampling to the tracking level.
With the abundance of sampling options listed above (chiefly being considering GA 360 if you have super high traffic levels), taking this option will inherently skew your data from the start. 


