
Looker Studio lost the ability to display Google Ads Auction Insights data on September 23, 2024. The auction insights data is still available in Google Ads, but if you are looking for a way to generate visualizations from this data, we have a free solution for you.
What is the Auction Insights Report?
The auction insights report allows you to compare your performance with other advertisers participating in the same auctions as you, and is available in search, shopping, or Performance Max campaigns. This information can help you make strategic decisions about bidding and budgeting by showing you where you are succeeding and where you may be missing opportunities for improved performance.
If you need a refresher on the data available in auctions and how to use it, check out Harnessing Auction Insights Data for Success.
Create a Free Auction Insights Report
In Google Ads, select the campaigns you want to collect auction insights data for. In highly competitive verticals, you may decide to run these reports weekly. Pulling this data on a regular cadence provides another opportunity to notice unusual trends in a timely way. We often pull data for campaign(s) that logically go together, such as brand and non-brand and choose a time period, say anywhere from 3 to 6 months to look back.
How to Export the Data from Auction Insights
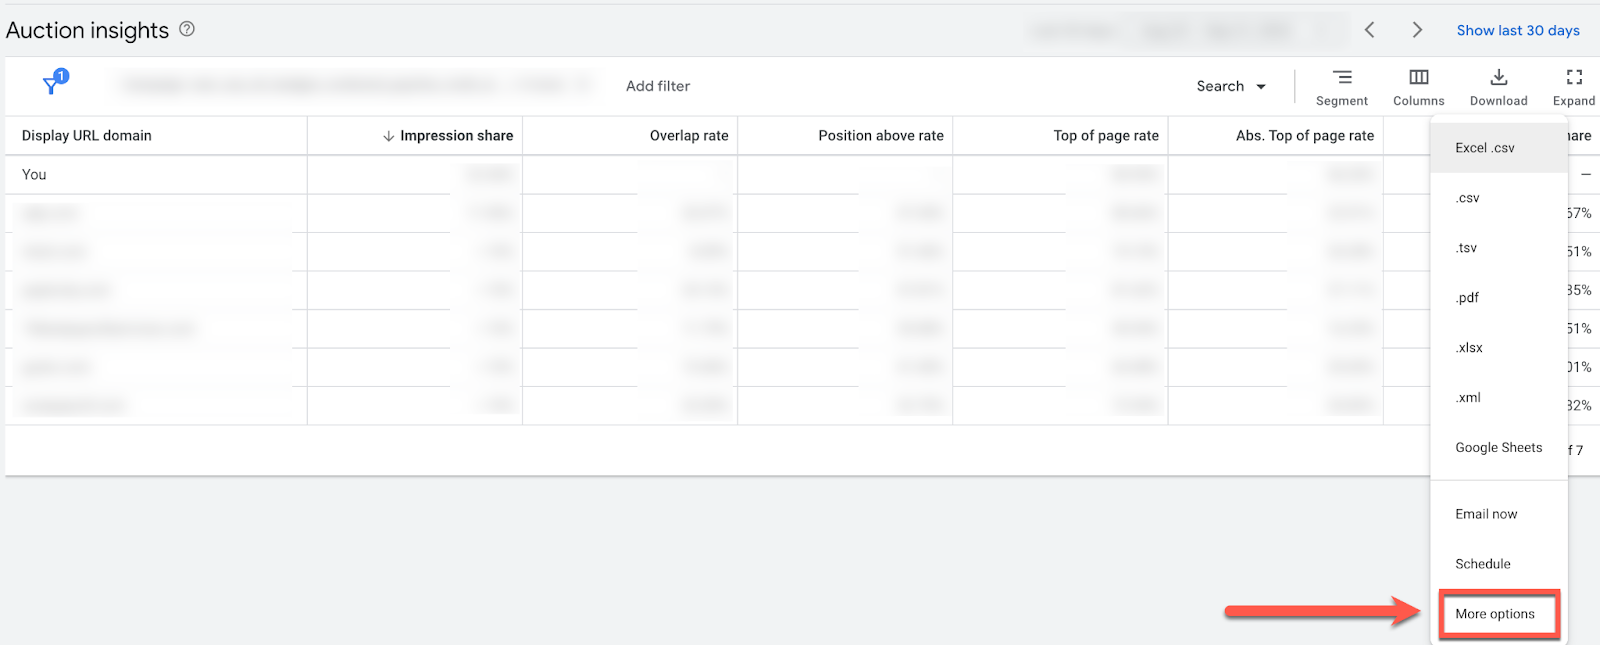
Once you have selected the campaigns to pull auction insights data for, choose the download menu and select “more options” at the bottom.
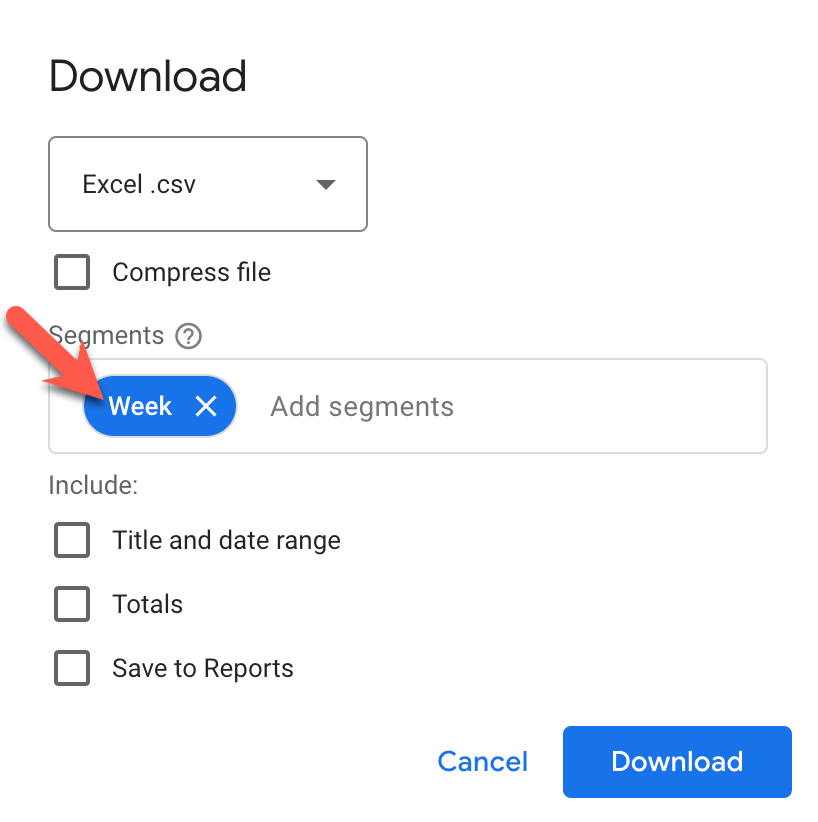
Choose the time segment you want to make data points for (day, week, or month) and uncheck the boxes under the “include” prompt.
Generate Your Report and Analysis
Use the Optmyzr Free Tool
Use the Optmyzr Auction Insights Visualizer to generate visualizations of your auction insights data. Select the competitors, chart type, and competitive metric. Print the chart or screen capture and add it to a deck for analysis.
[TIP] Take 5 minutes and watch the help video from Optmyzr.

Generate Your Graphs in Excel or Google Sheets
If you want to flex your Excel or Google Sheets muscles and generate your analysis using spreadsheets:
- Export the auction insights data from Google Ads (as shown above)
- Import the data into Excel or Google Sheets
- Clean and format the data
- Convert “<10%” values to “5%” for analysis
- Create pivot tables for analysis
- Create charts or graphs to visualize the data
From Google Sheets, Import Your Data into Looker Studio
If you prefer to continue using Looker for Auction Insights reporting and analysis, you can export your data into Google Sheets and then connect it to your Looker dashboard.
Coming Soon: AI-Powered Solutions?
How will you adapt to losing the ability to directly import auction insights data into Looker? The free options listed here are a stop-gap solution. We anticipate creating more automated solutions such as creating a CustomGPT or another AI-powered solution to efficiently deliver auction insights analysis in the future.