Want more efficient campaigns, higher CTR, and more conversions? Who doesn’t? While there are many levers to pull when optimizing accounts, a great place to start is by analyzing keyword Quality Score (QS). Quality Score is made up of three different variables:
- Expected CTR: The estimate of how many people will click through ads to a landing page based on historical keyword performance.
- Landing Page Experience: How well your landing page gives searchers what they are looking for.
- Ad Relevance: How relevant your ad copy is to user’s search queries.
All three of these factors are ranked by Google as either below average, average, or above average and impact just how well your campaigns are performing. The higher your Quality Score, the more likely your ads are to be served, which means more traffic and conversions! These factors also provide great indicators of where you should be focusing your optimization efforts. Read on to see how Seer assesses QS and turns that data into actionable next steps to improve PPC campaigns.
Quality Score Dashboard - What is it?
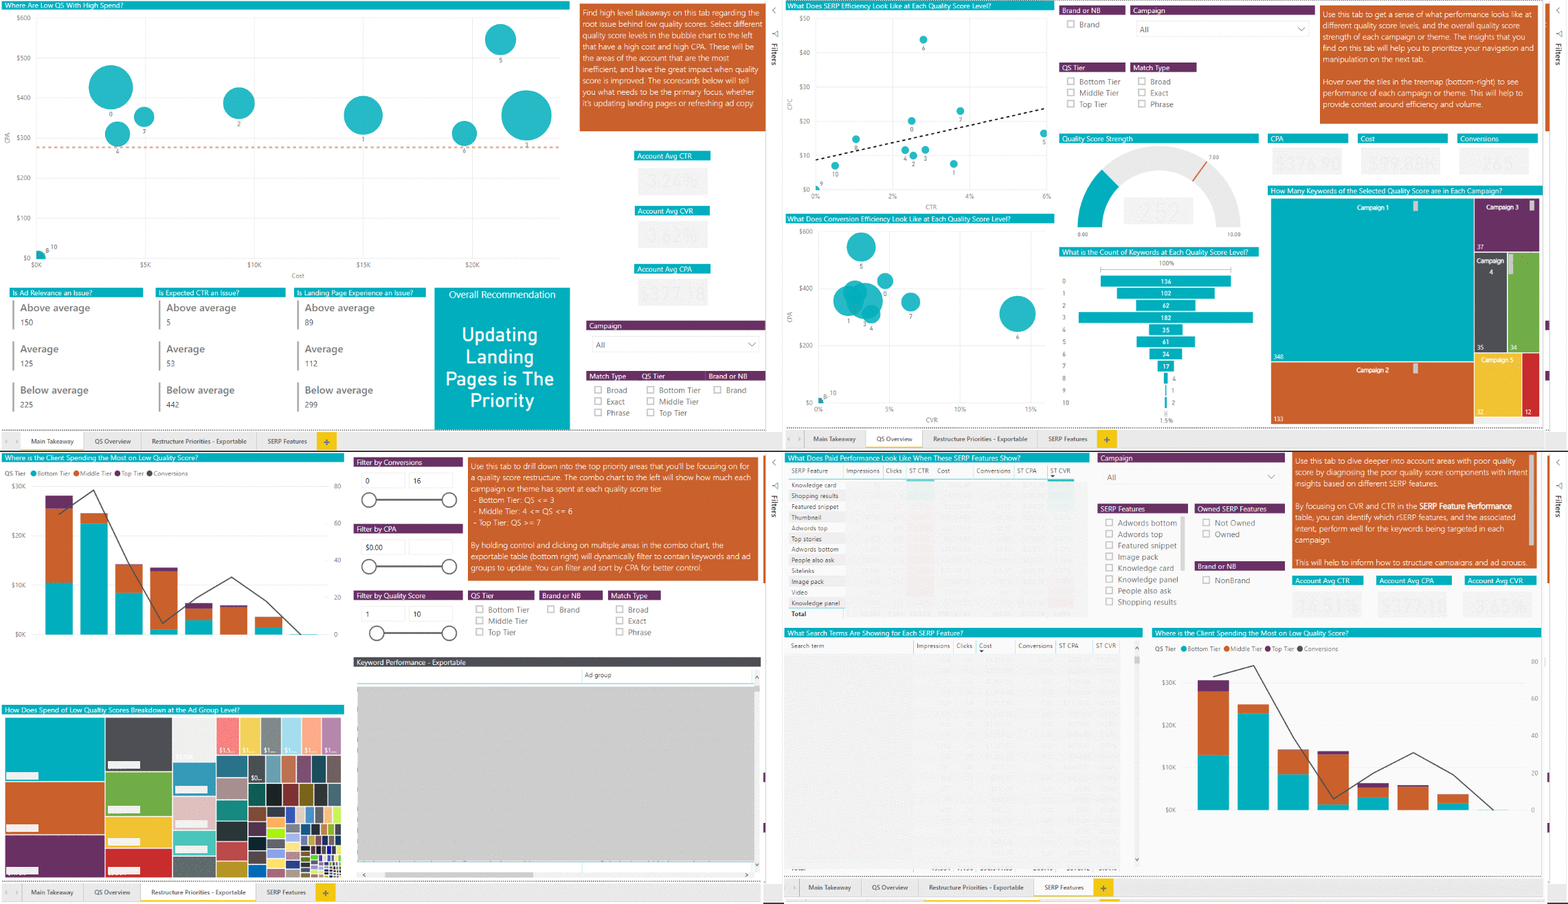
Seer leverages a PowerBI Dashboard, built in-house by the Data Strategy Team, that allows us to easily identify areas for improvement based on Quality Score metrics.
Unfamiliar with PowerBI for search marketing? Read the Power BI Guide
We use this dashboard to:
- Find high-level takeaways, pinpointing the root issue behind low Quality Scores
- Determine what should be our primary focus, whether that be updating landing pages or refreshing ad copy
- Get a sense of what performance looks like at different Quality Score levels
- The overall Quality Score strength of each campaign or campaign theme
- Diagnose poor Quality Score components with intent insights based on different SERP features
This dashboard outputs our priorities in terms of Quality Score optimizations within seconds and allows us to start making recommendations ASAP. Dashboards like these have enabled the Seer team to spend more time on optimizations and less time formatting data in a way that can be easily digested and analyzed.

How We Used it to Guide Recommendations
Landing Page Recommendations
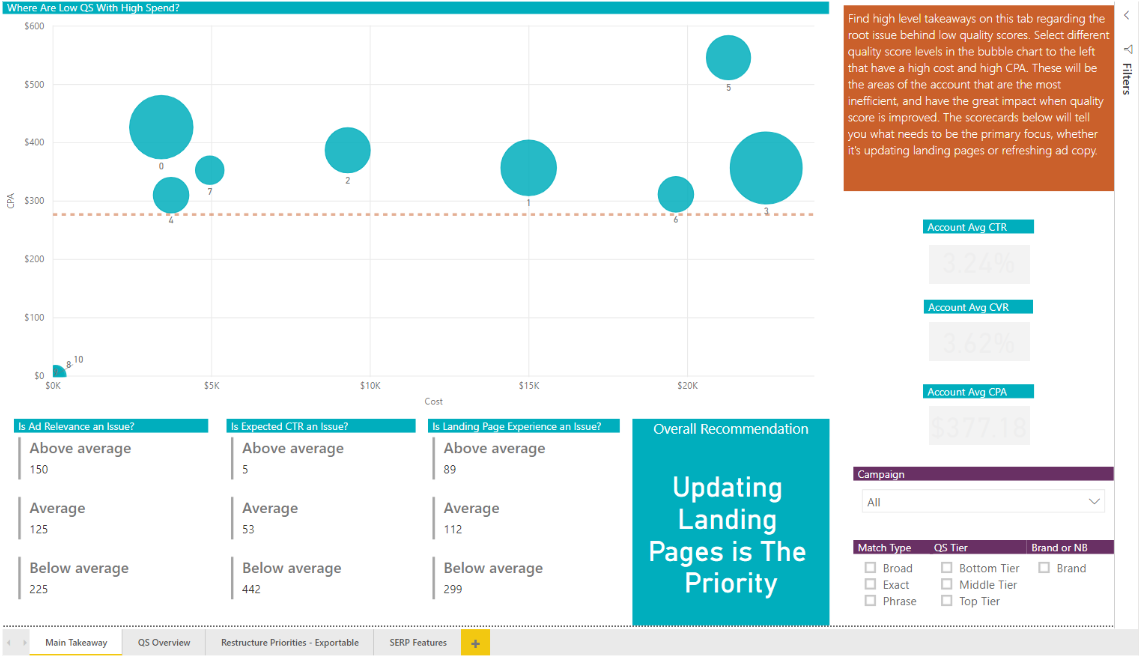
The first tab of our dashboard tells us exactly what the highest priority items are, or what the root issues behind poor QS are. Whether that’s updating ad copy or updating landing pages. We filtered this tab to look at only the campaigns in question and saw the following:

The bubble chart and tables above noted that updating landing pages in this campaign should be the highest priority optimization. This view also tells us exactly how many keywords (and which keywords) have driven above-average, average, or below-average ad relevance, expected CTR, and landing page experience.
We were able to look at the 4 keywords that drove below-average landing page experiences and provide content and copy recommendations for the landing page that those keywords were driving to. In this specific example, this was a Brand campaign and the 4 keywords were the brand name appended to a few services they provide.
Our specific recommendations were to incorporate the brand name more frequently on the landing page and include content on the landing page for 2 of the keywords that were ranking low, which were services provided by the client.
Dynamic Keyword Insertion (DKI) Ad Copy Recommendations
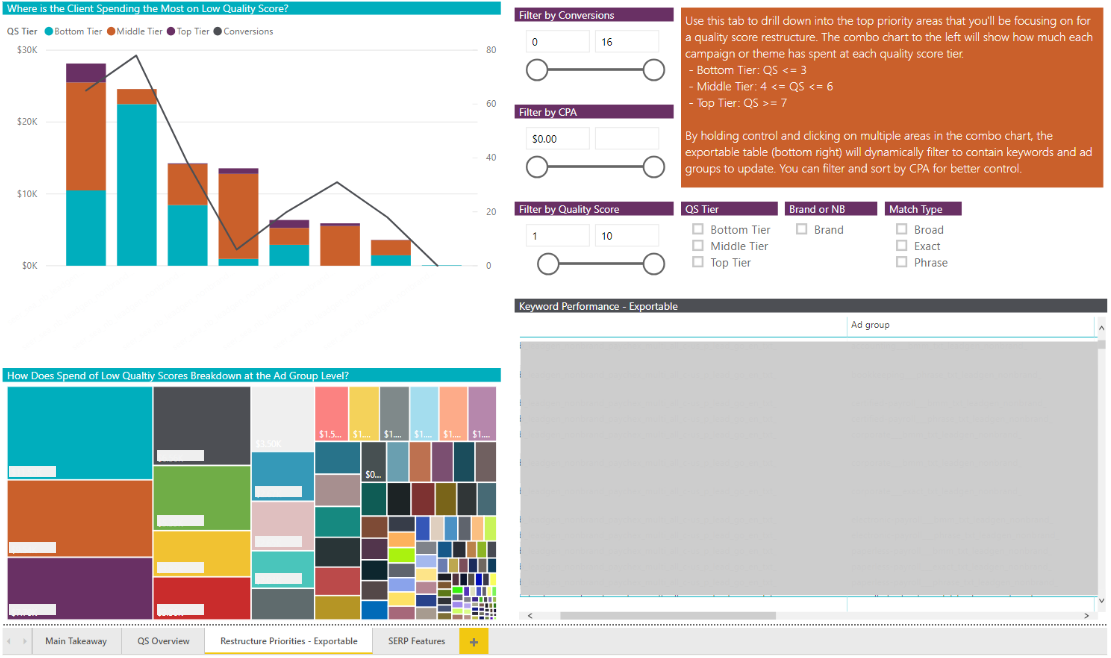
We also looked into another campaign, which noted that 133 keywords were triggering low Quality Scores due to below-average ad relevance. Therefore, updating ad copy was the main priority for this batch of keywords. From here, we prioritized ad groups that were driving the highest spend on low Quality Score keywords, which our dashboard outputs for us in a nice chart (top left corner of the below image).

We recommended implementing DKI ads in order to increase Ad Relevance and Expected CTR. DKI allows you to customize ad copy based on a user’s search query. This allows for more specific targeting and encourages higher CTR, as people are more likely to click on an ad that closely resembles what they are searching for.
DKI is especially helpful when needing to update large quantities of ads, as it saves you from having to customize copy on an individual basis. Check out our blog on PPC tips and tricks for more information on how DKI works and how you can easily implement this tactic for your own campaigns.
Results
In order to gauge the success of these Quality Score optimizations, Seer implemented our landing page and ad copy recommendations, providing the client with periodic check-ins of campaign performance.
Landing Page Results
For this particular Brand campaign, we saw a +6% improvement in CVR and +30% improvement in CPA after implementing landing page recommendations from this analysis. These improvements can be attributed to updating the landing page content to be more relevant to what users are searching for, as well as an overall improvement in Quality Score.
Although minimal, this campaign drove a +3% improvement in Landing Page Experience and +2% increase in overall Quality Score, helping improve overall efficiency and user experience within this campaign.
Dynamic Keyword Insertion Results
For this particular campaign, we initially identified 29 ad groups containing below-average ad relevance keywords. One month after testing DKI ads, 18 of the 29 ad groups increased in ad relevance, with 14 ad groups now scoring “average” and 4 ad groups scoring “above average.”
When broken out to the ad level, Seer found that DKI ads saw a statistically significant improvement in CTR (up +24%) when compared to static text ads. In order to capitalize on this higher performance, we expanded DKI use across a couple more of this client’s campaigns and saw CTR increase by up to +52%!
As these optimizations show, sometimes the smallest updates can have a profound impact on overall campaign performance.


