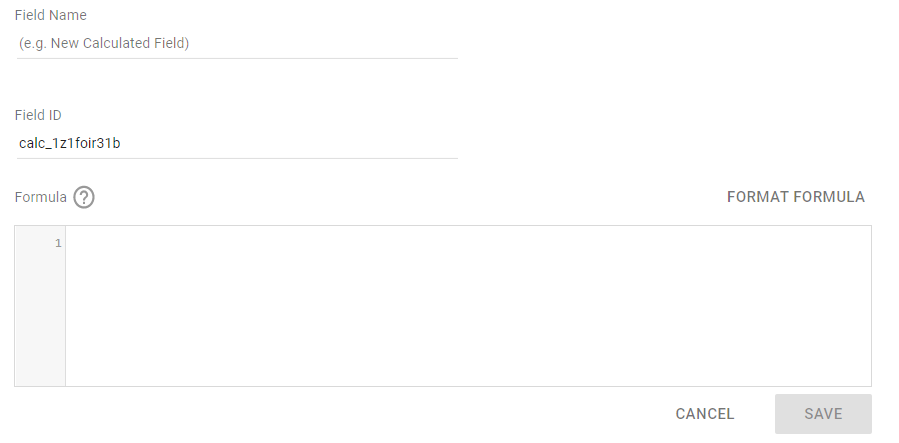
What Are Calculated Fields?
Calculated fields allow you to create new or custom metrics or dimensions in Google Data Studio from your existing data. You can perform calculations, create categories, or transform your data with calculated fields.
How to Create Calculated Fields
- Log in to Data Studio under the account with ownership of the data source you’ll be using to create your calculated field.

- Navigate to Resource > Manage added data sources

- Under actions, click Edit for the data source (you can also click the pencil icon from the dashboard when selecting a visual that uses that data source to open the editor)

- Click Add A Field

We recommend using a special character (such as an asterisk *) when naming custom fields in Google Data Studio. This does two things - 1) pushes them to the top of the 'Available Fields' list and 2) makes it easier to differentiate between custom fields and default dimensions/metrics in your data source.
How to Use Calculated Fields
You can use calculated fields to answer questions that couldn’t be answered with data in its current state. That includes doing everything from creating new custom metrics to transforming multiple dimensions in order to analyze the data in different ways.
| ⚠️WARNING: If you directly copy & paste formulas from this post - make sure the formatting isn’t being altered (e.g. in GDS make sure the dimensions exist in your data source and double-check your quotes).⚠️ |
Some helpful ways to use calculated fields include:
1. Making New Metrics
Create your own metrics by simply adding the formula for your metric into the calculated field.
Consolidate Goals
If you have two separate goals that you’d like to view as a single metric, just add them together:
Goal 1 + Goal 2
Find Conversion Rates from Funnel Stages
If you track conversion funnel stages in Google Data Studio you can determine conversion rates from stage to stage by creating your own conversion rate metric:
Stage 2/Stage 1
2. Tracking Progress to Goals
Create a scorecard that tracks your progress to goals by creating a simple calculation of [Goal Metric]/Goal Value:
Sessions/10,000
Keep in mind that your metric is affected by date range but your value won’t be - ie, if you’re putting in your monthly goal, make sure your visuals date range is set to that month; if you’re putting in a yearly goal set your date range to the entire year.
3. Combining Dimensions
If you need to combine multiple dimensions (like Hostname + Landing Page Path to make your URLs clickable) you can use the CONCAT function:
CONCAT(Hostname, Landing Page)
4. Removing Trailing Slashes
If your site has mixed trailing vs non-trailing slashes on URLs that are causing your data to split in reporting, this tip is just a band-aid - you should first remedy the issue by enforcing either trailing or non-trailing slashes to your URLs to prevent duplicate content - otherwise you’re just masking the problem.
But let’s say you have already addressed trailing vs non-trailing slash issues, but your reporting compares data over historical date ranges - you’ll want to consolidate your URLs for a more accurate comparison over time.
We can use REGEX_REPLACE to remove the trailing slash from any pages that end with one:
REGEXP_REPLACE(Landing Page,"/$","")
5. Keeping Case Consistent
Similar to our fix for removing trailing slashes in URL strings, the best fix here is to maintain consistent case in your URLs. But if you need to consolidate dimensions by forcing lowercase, it’s an easy formula:
LOWER(Landing Page)
6. Removing Query Parameters
Make sure you use the double backslash \\ in Google Data Studio as an escape in this formula to remove ? parameters:
REGEXP_REPLACE(Landing Page, '\\?.+', '')
Creating Custom Groups with CASE Statements
This is one of our favorite uses with calculated fields - creating custom groups by using CASE statements in Google Data Studio. You can diagnose issues with content types, combine geolocations to review an entire region, consolidate outdated products or pages - possibilities with custom labeling are limitless.
Below are some of the most often-used CASE statements for SEO reporting:
7. Grouping Content
Quickly group landing pages together by subfolder or URL - this is also highly valuable if you’ve consolidated or redirected content (you can group the multiple URLs under a single label so that you’re making accurate period over period comparisons).
CASE WHEN REGEXP_MATCH(Landing Page, "example.net") THEN "Homepage" WHEN REGEXP_MATCH(Landing Page, ".*/product/.*") THEN "Product" WHEN REGEXP_MATCH(Landing Page, ".*/solutions/.*") THEN "Solutions" WHEN REGEXP_MATCH(Landing Page, ".*/blog/.*") THEN "Blog" ELSE "Other" END
8. Categorizing Branded vs Unbranded Searches
Quickly group keywords, search terms, or queries from Google Search Console, SEMrush, or other tracking tools into branded and unbranded groups. Just make sure you review your branded misspellings as well!
CASE WHEN REGEXP_MATCH(Query, ".*(seer|wil reynolds).*") THEN "Branded" ELSE "Unbranded" END
9. Grouping by Rank (Position)
CASE WHEN Position <11 THEN "Page 1" WHEN Position <21 THEN "Page 2" WHEN Position <51 THEN "Pages 3-5" WHEN Position >50 THEN "Pages 6+" ELSE "Non-Ranking" END
10. Solving (Other) Attribution
Does your website drive traffic from the "(Other)" Default Channel Grouping in Google Analytics? If so, you can easily create the following CASE statement in Google Data Studio for troubleshooting and fixing it.
Step 1: Return (Other) as Source / Medium
CASE WHEN Default Channel Grouping = "(Other)" THEN Source / Medium ELSE Default Channel Grouping END
This CASE statement will return the Source / Medium(s) being categorized as (Other) so you can identify what's being grouped incorrectly. For example, say it returned the following:
- newsletter / email
- facebook / (not set)
- twitter / (not set)
Step 2: Recategorize (Other) Values
CASE WHEN Source / Medium = "newsletter / email" THEN "Email" WHEN REGEXP_MATCH(Source, "facebook|twitter") AND Medium = "(not set)" THEN "Social" ELSE Default Channel Grouping END
Voila - you've gotten rid of that pesky "(Other)" channel data!
If you're looking for a more permanent solution to (Other), update your Channel Grouping Settings in Google Analytics to ensure data collected from these Source / Mediums are appropriately categorized in the future. Additionally - consider revamping your campaign tagging strategy moving forward!
Want more examples you can copy/paste? Check out our post on how to create CASE statements in Data Studio for creating social sources, building engagement groups by page depth, comparing channels, and more!
Hopefully you found these 10 ways of using calculated fields in Google Data Studio useful! Let us know which fields you end up creating in the comments below or mention us on Twitter (@SeerInteractive).


