You’ve Been Sampled.
Data sampling is a technique used in statistical modelling that allows analysts to utilize a smaller portion of data to represent a larger portion of that data. While it’s not always a bad idea, it’s something that you should always note when analyzing data from Google Analytics.
Why Should You Care If Your Data Is Sampled?
Take this scenario: You want to compare conversions driven by paid sessions year-to-date vs. last year-to-date (YoY). Easy, right? You add the Paid Traffic segment, navigate to the Acquisition Report in Google Analytics and voila!
You’re able to report an increase in goal completions by +14% YoY!
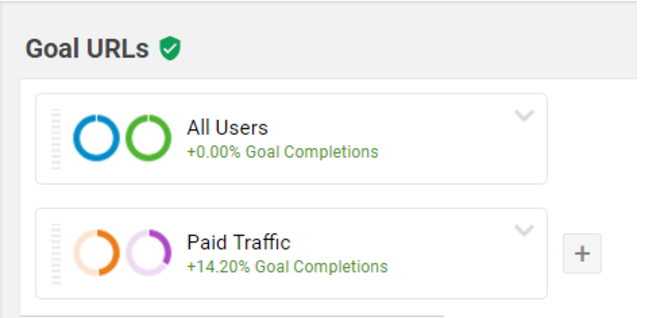
You drill down further, adding an Advanced Filter so you can understand how specific Goal URLs performed.
Notice something different about your data? Surprise! You’ve been sampled.
Now, when you note percentage change in conversions YoY, you see that Paid Traffic is somehow down by -3%.
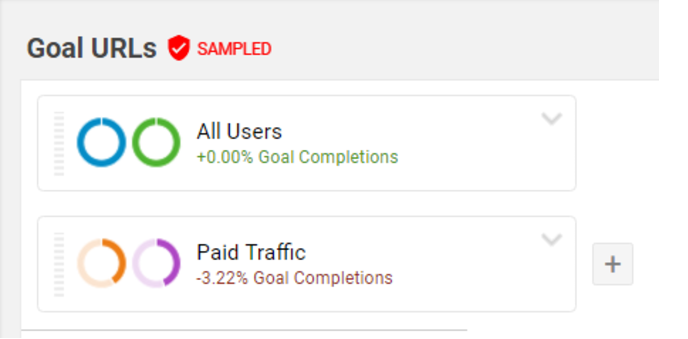
But wait, how could that be? You just reported on an increase of +14%...
You decide to view the data separately - removing the comparison period so the date range is solely January 1, 2017 - July 1, 2017. Here’s what you record:
FY 2017 (Conversions)
- All Users: 522,620
- Paid Traffic: 345,474
Next, you duplicate your tab, change the date range to January 1, 2016 - July 1, 2016 and note something odd:
FY 2016 (Conversions)
- All Users: 509,469
- Paid Traffic: 303,942
Paid Traffic did increase in conversions YoY (303,942 in 2016 vs. 345,474 in 2017). So, what happened before when you compared the date ranges using the Google Analytics date tool?
In short, viewing data through the lense of two segments (All Users vs. Paid Traffic) was deemed an ad-hoc query by Google Analytics, and thus subject to sampling. Why? Because comparing the two date ranges increased the number of total sessions (beyond the sampling threshold of 500,000).
Ad-hoc queries are subject to sampling if the number of sessions for the date range you are using exceeds the threshold for your Property type.
In short, you're only looking at a portion of your website data - you aren't getting the full picture of your performance.
Stepping out of our scenario, you can see why this is a huge problem when reporting on website metrics. If you're using Google Analytics to report on revenue or goal value - sampled data can be even more detrimental to your business.
Is Your Data At Risk Of Being Sampled?
As of July 2017, the threshold for Google Analytics sampling is 500,000 sessions at the Property level for a given date range.
Much like in our above scenario, sampling can lead to data discrepancies that cause inaccurate performance measurement. Though it may be tempting to slice and dice data to capture keen insights, avoid sneaky nuances like sampling by reading our top tips below.
Recommend Ways to Fight Data Sampling in Google Analytics
Now that you know why and how data sampling can affect your data, our very own Seer Analytics team has a few recommendations for combating it:
#1: Our Chrome Extension
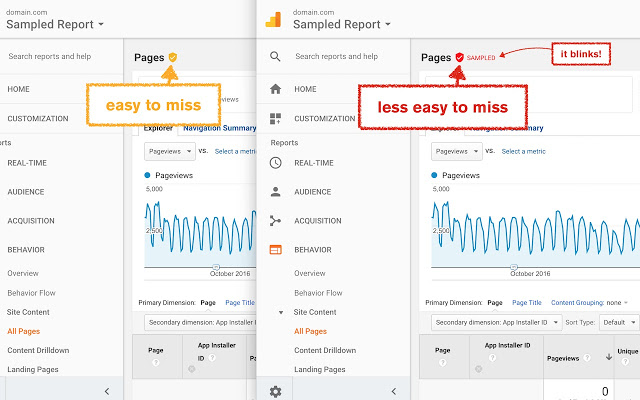
Use this Chrome extension, created by our in-house developer, Stephen Harris, that flashes “SAMPLED” next to the corresponding icon in GA (as shown below) when you reach the threshold level.
#2: The Unsampler Tool
This nifty tool recommended by Patrick Strickler is best used for ad hoc pulls of unsampled data. First, connect to GA and configure the report to best suit your analysis.
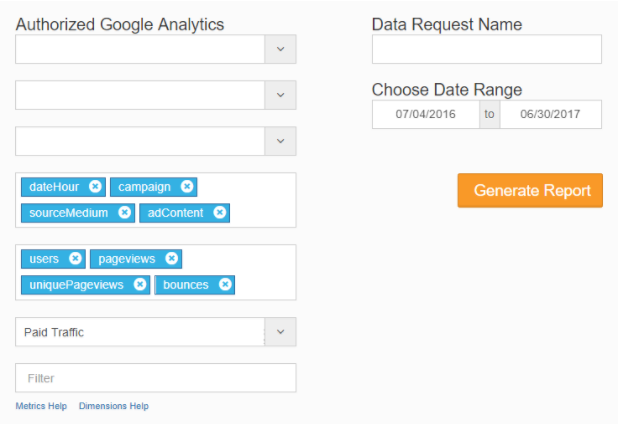
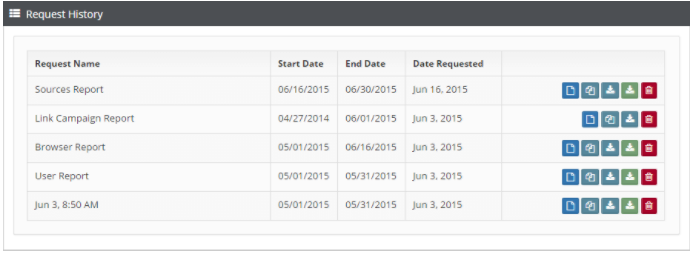
Next, generate your report and wait for unsampler.io to validate your request with Google. Once it’s done, choose to Copy/Paste your unsampled data or download it into a file for further analysis (Unsampler.io allows for exporting Excel or CSV files).
Behind the scenes, this tool breaks down your data into smaller time frames and then aggregates it back into one range - avoiding sampling altogether.
#3: Google Analytics API Integration
Another way of avoiding issues associated with sampling is through the Google Analytics Spreadsheet Add-On - note, this one is advanced (i.e. you might need us!) This is something we regularly use at Seer to query data from the Analytics API in Google Sheets.
If you want to learn more about this integration, read this post for the basics.
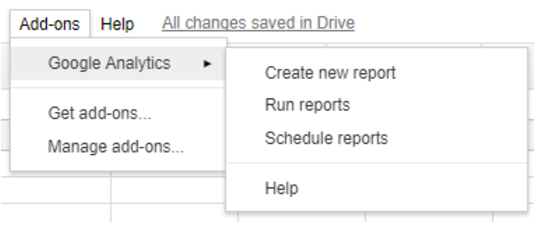
To avoid sampling, manually pull GA data into separate time ranges and then use formulas to put it all back together again (just as Unsampler does behind the scenes).
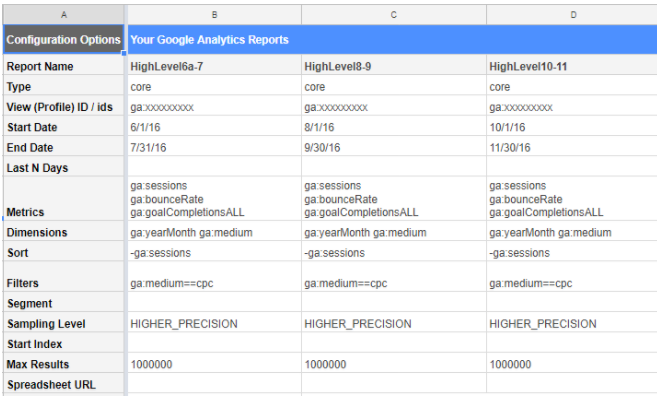
It may not seem like a preferred way of pulling data but trust us, the API is the way to go when you want ultimate control of reporting and dig automating the repetitive stuff.
If Sheets isn’t your thing, check out this old post from Michelle Noonan, that details how to unsample data using advanced Microsoft Excel formulas.
#4: Google Analytics 360
If you want to “pay to play”, research Google Analytics 360. The biggest benefit of this product is that it heightens the sampling threshold from 500,000 sessions to 100 million - allowing you to get a true picture of your data.
This more robust option from Google allows companies with a higher quantity of hits (i.e. pageviews, events, etc.) to integrate all of their digital marketing solutions for more accurate reporting - leading to better decision-making.
NOT A GA360 CUSTOMER BUT CURIOUS TO LEARN MORE?
#5: Reporting Automation
Just a few years ago, the buzz phrase, “data warehouse” didn’t exist in digital marketing. Today, it’s something that companies strive for.
With data warehouse automation, you can essentially limit the time it takes analysts to extract, transfer, and load data in order to report and analyze it. This heavy duty solution is ideal for those who understand the importance of cutting down the time and effort required by humans to report and analyze on recurring data sets.
Did you give any of our solutions for data sampling a try? Have any more questions regarding this (or any other) Analytics problem? We’d love to hear about it in the comments below, directly, or on Twitter.


