Does Page Speed Affect SEO?
From a user perspective, site speed is only a problem when it’s broken. When all is well, no one notices, let alone, appreciates it’s seamless functionality.
As users, we don’t appreciate site speed because we live in an era of immediacy and expected outcomes. As SEOs, we know this user experience is the end-all-be-all to success and is critical in providing an enjoyable user experience while guiding consumers down the pipeline.
Conducting page speed tests are a fundamental element of user experience. Lagging sites on both desktop and mobile, are the largest contributors to high bounce rates and lack of conversion.
Nobody wants that. However, there is a solution!
Google PageSpeed Insights.
This how-to guide will dive into why these updates came about, how to conduct a page speed test, how to locate this tool as well as insights on usage to further your SEO initiatives to faster site speeds and high conversion rates!
What Did This Update Accomplish?
Last November, Google rolled out an improved site speed report located in Search Console in order to conduct website speed optimization. Sympathizing with the public need for faster browsing experiences, the Google Webmaster blog stated the goal of these updates:
“The report classifies URLs by speed and the issue that causes any slowdowns. Drill down on a specific issue to see examples of slow URLs to help you prioritize performance improvements for them. To get a better sense of what type of optimization can be performed for a specific URL, the report links to the Page Speed Insight tool, which provides information on specific optimization opportunities” (Google Webmaster Blog).
Speed testing is at the crux of SEO and is one of the foundational pieces of user experience. These updates ultimately allow us to provide actionable instructions to check site speed, correct speed issues and diagnose problems using Google’s robots.
In the next few steps, I will go through my process of diagnosing page speed along with providing additional tools to enhance your analysis of page speed.
How Do I Use the Google Page Speed Report & How Can I Check My Website Performance?
The premise of these updates is to give live insights from Search Console data and consolidate all of the URL issues in one report. Gone are the days of inserting individual URLs for outdated data. With this Search Console report, we are able to consolidate page URLs and extract live data.
So that all seems efficient, but how do we actually accomplish this?
Through Google PageSpeed Insights and Google Search Console!
What is a Good Google Page Speed Score?
Through the use of Google PageSpeed insights and Google Search Console, you are able to find your page speed score of your site for both desktop and mobile. Each URL is ranked from 0 to 100, but a score of 85 or above from your page speed analysis is considered great for site speed health.
Where Do I Find the Google Page Speed Report?
1. Log in to Search Console and find the Google Page Speed Report
Upon logging into Search Console, you will navigate to the Enhancements tab and click on ‘Speed’ from the drop-down. Simple as that.
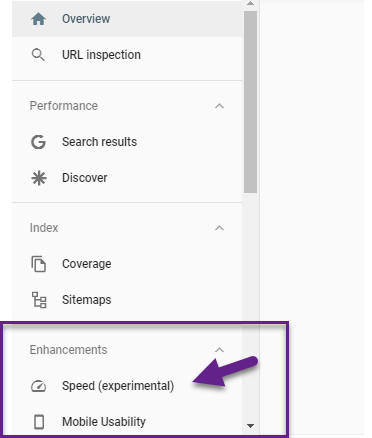
Great, you’ve gathered some insights from the user experience tool and you’re in Search Console.
Now what?
2. Open your Mobile and Desktop Reports 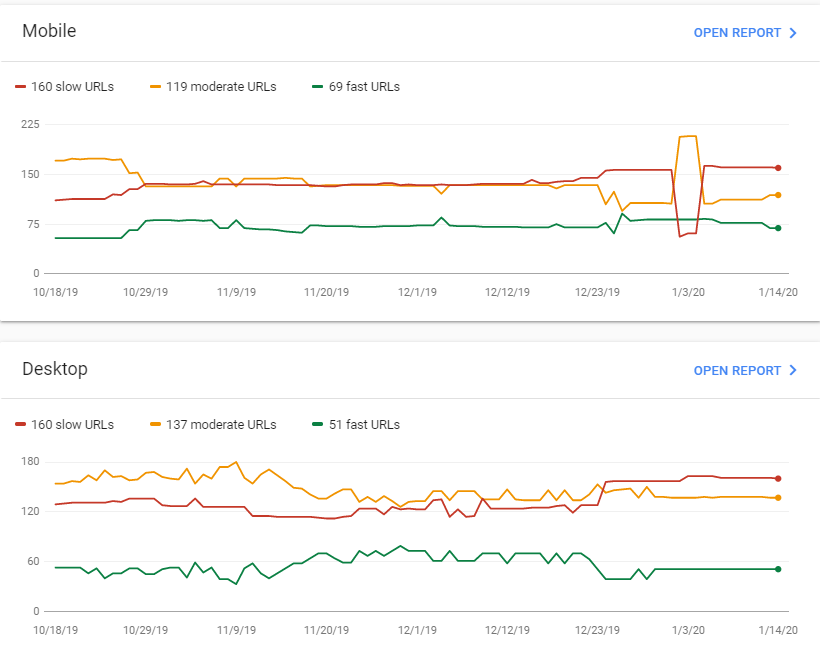
At first glance, you will notice green, yellow, and red lines correlating with slow, moderate, and fast URLs. I personally begin with mobile, since it tends to have the most errors, but it entirely up to your preference. In order to begin viewing a report, simply click the ‘OPEN REPORT’ tab and you will be directed to the report of your choosing.
3. Analyze Your Speed Report (Mobile or Desktop)
Upon looking at your report, you will notice dips and gaps. I tend to start with those first to investigate if something good or bad happened around that date. Finding the causation will give you historical context and will enhance the validity of your recommendations.
Questions to Ask:
- Were new pages launched during these increases/decreases?
- Did they upgrade the CMS?
- Were pages deleted during this time?
- Were graphics added?
- Were graphics optimized?
Finding historical context behind dips and peaks will allow you to give better insights on the causations of moderate and slow URLs.
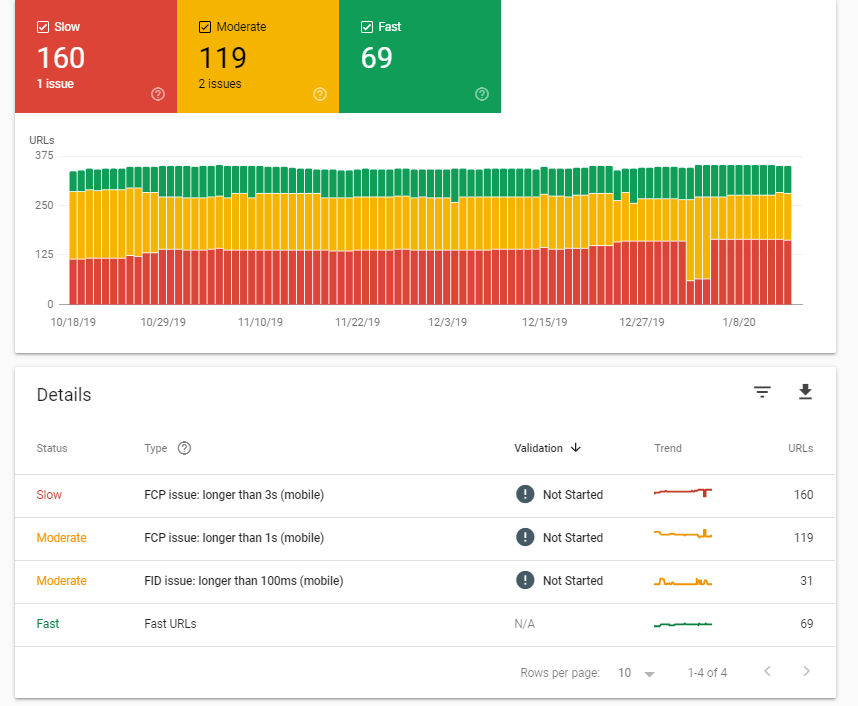
4. Understand the Details - What Do These Metrics Mean?
From the example above we can notice two causation factors that align with our Search Console tool from earlier. The key factors that stick out are the FCP and FID issues that are affecting a combined 310 URLs in this example.
As defined by Google Developers:
- First Input Delay Issue: First Input Delay (FID) measures the time from when a user first interacts with your site (i.e. when they click a link, tap on a button, or use a custom, JavaScript-powered control) to the time when the browser is actually able to respond to that interaction (Philip Walton).
- First Contentful Paint Issue: First Contentful Paint (FCP) measures the time from navigation to the time when the browser renders the first bit of content from the DOM. This is an important milestone for users because it provides feedback that the page is actually loading (Google Developers).
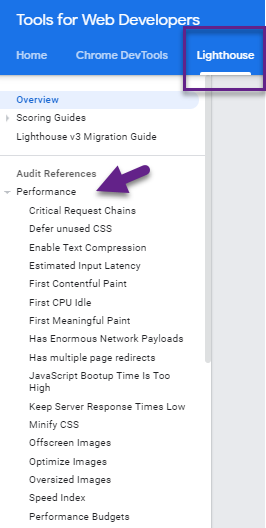
Other common issues that you may encounter include:
- Critical Request Chains
- Defer unused CSS
- Enable Text Compression
- Estimated Input Latency
- First CPU Idle
These definitions can be found can be found in Google Tools for Developers within the Lighthouse section under the ‘Performance’ tab
5. Locate Specific URLs and Plug-In to Google Page Speed Insights Tool
In order to locate the exact URLs that are slow or moderate, you must click on
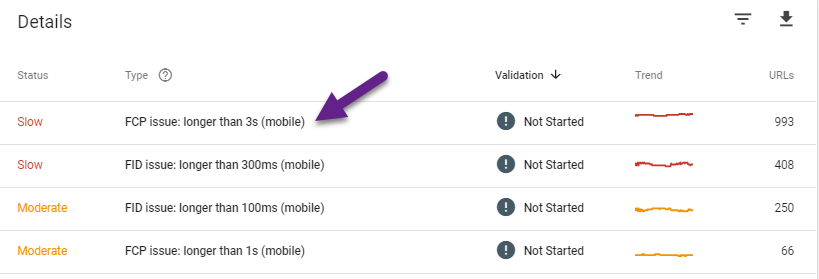
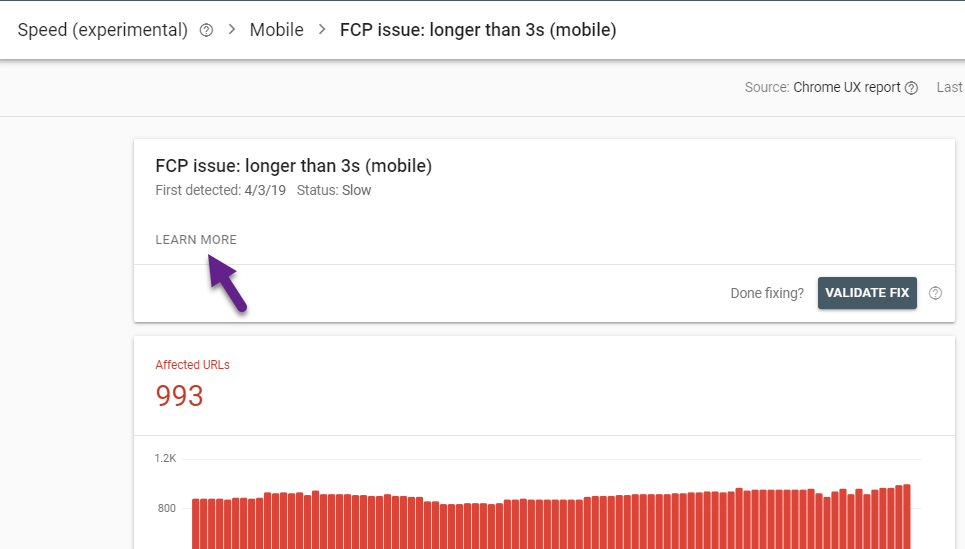
Click on the issue itself and it will take you to another drop down in which you can choose to learn more and eventually validate the fix to be submitted back to Google.
By clicking on learn more in the new screen, you can learn more about the issue and what the next steps are to fix this issue which can give further context to your next steps.
7. Use the Google Chrome User Experience Report
After digging into Search Console, take the URLs showing issues and plug them into this tool known as the Chrome User Experience Report.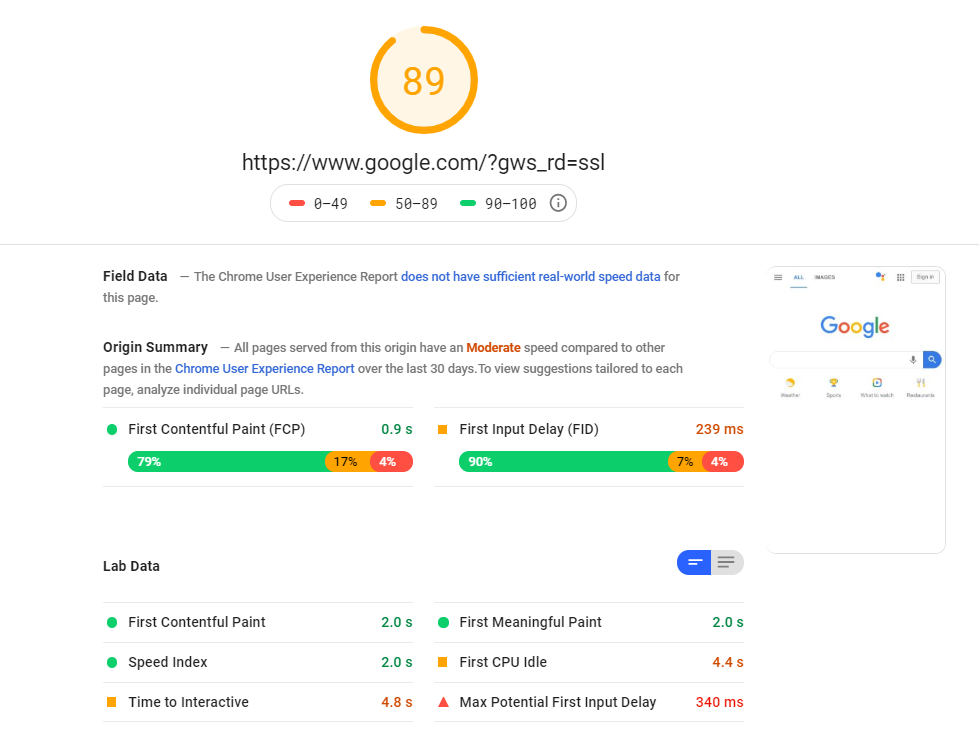
From here, you can gather a few insights with these 3 next steps:
Look at speed score as a guiding light
- In this case, it is 89 loading at around 2 seconds
- According to Semrush’s blog on page load time, “if your site loads in 2.9 seconds, it is faster than approximately 50% of the web. if your site loads in 1.7 seconds, it is faster than approximately 75% of the web. if your site loads in 0.8 seconds, it is faster than approximately 94% of the web” (SEMrush).
- These statistics are always good to keep top of mind when conducting these analyses
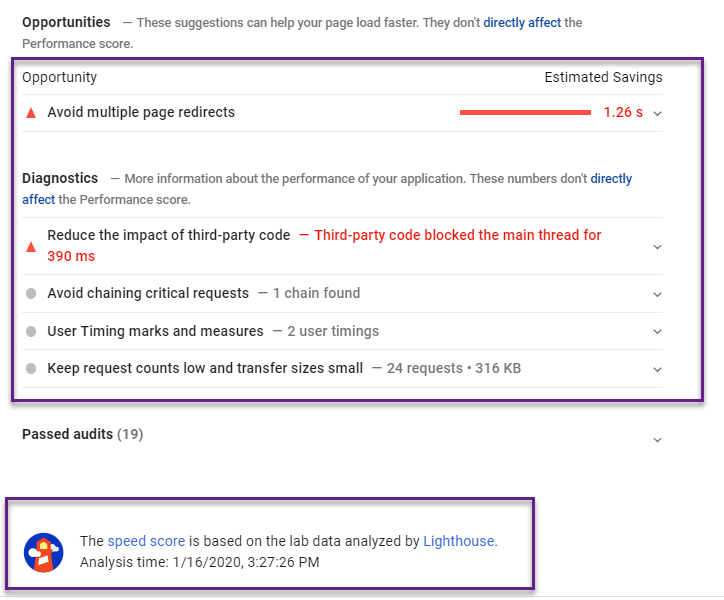
Note the immediate opportunities
- To note, sometimes there are reasons as to why things are currently put in place, so I always double-check these opportunity gaps with a web developer to understand the true merit
Look at ‘Passed Audits’
- This can be accessed by clicking the dropdown
- Taking a moment to see what is going well with the URL is useful for when you are presenting recommendations
Now you are ready to compare live insights gained from Search Console and supplement recommendations with the page insights tool.
Ultimately, combining insights gained in both tools leads us to both live and historical data insights on specific URLs and will give you a great starting place to begin improving site speed!


