It's a simple but sometimes difficult question to answer and is asked by many. From mom-and-pop small business owners to CMOs of Fortune 25 companies. We're going to explore a few data-driven ways to arrive to the answer the question: what do I publish and when? We analyzed over half a million data points from Google Trends, SEMrush, and Google AdWords, and visualized them using interactive network and line graphs, motion charts, heat, and tree maps.
For visual learners, here is a video that walks through the blog post and strategy but feel free to skip over it if you want to dive right in:
To run through the process of answering what and when to publish content we'll need an example. We're stepping into the shoes of a content manager at a cancer hospital located in the United States for this blog post.
The goal is to know what and when to publish but before we can talk about that, we need to understand our audience and the best way to engage them. It might not be a content strategy on your blog. It could be a video strategy or something else.
Here is the roadmap for the blog post:
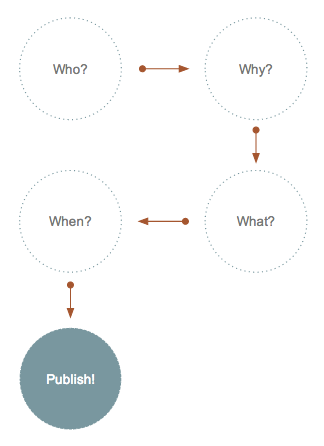
Let's dive into the who and why first.
Who is my audience?

We need to determine who we are trying to engage with our content to understand their needs and how we can best meet those needs. This traditionally can be done with focus groups, interviews, surveys, etc.
There's so much data available online, we can use search to find what an audience needs are then define those audiences.
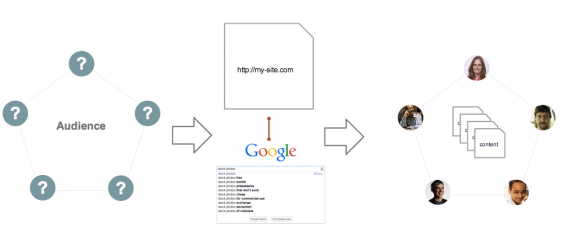
In this example, our audience revolves around families struggling with cancer. We are keeping it broad in this case, but you might want to further refine your audiences. For example, it could be mothers whose parents are struggling with cancer.
Why do I want
to publish content?

There could be a myriad of reasons why someone would want to publish content. At its most common and simple essence, content is meant to engage an audience to do something which could be brand recognition to making a purchase.
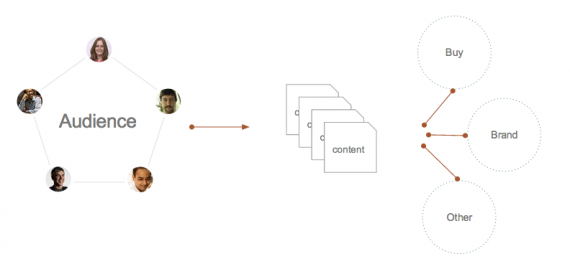
For our cancer hospital, our intent is to take our marketing budget and invest in content that will increase brand awareness.
What content do
I publish?

At this point we have decided why we are publishing content and defined our audience. Next, we'll explore what content we should publish then when to publish it.
Content Ideation
Let's start at Google Trends to brainstorm what content we should explore. Why Google Trends? Google Trends has an incredible amount of information on entities (people, places and things) and search data that can present new opportunities even industry experts might not think of. For instance, when we ran this analysis, Farrah Fawcett surfaced as a topic related to cancer. We did not use that information but it could have tied into a content campaign.
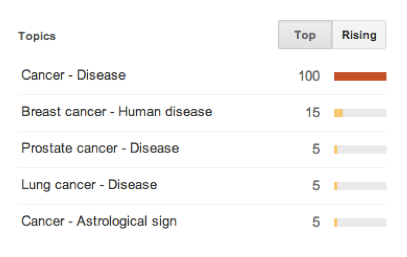
We'll explore the entity of cancer, then pull 10 years of topics by month to see which are most frequently used for the entity of cancer. We found that ovarian, breast cancer, and a few other topics are very frequently associated with cancer and excluded topics with low frequency, such as Farrah Fawcett, for this analysis.
We'll then pull monthly keyword data for each topic for the last 10 years to understand which terms are most frequently associated with each topic. The last step of the process in keyword ideation is choosing those that are representative for each category.
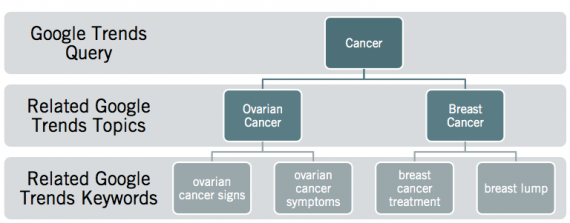
Here is the step-by-step of the process in Google Trends:
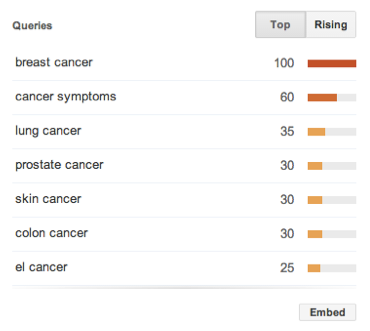
Step 1: Query Google Trends for the topic of cancer:
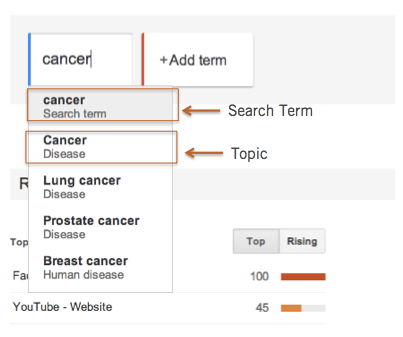
Step 2: Pull 10 years worth of monthly topic data for the topic of cancer:
Step 3: Pull keywords for the above topics every month for the last 10 years:
We can see the relationships between all keywords pulled and how they relate to their parent categories in the network graph below. The width of the arrow indicates the relevance to the term.
Interestingly, ovarian cancer is tied to cervical cancer in the analysis. If we were to talk about cervical cancer, we might also want to explore ovarian cancer.
Topic Growth
The next iteration is to identify the rising trends from the representative keyword set selected from our process above. We pulled Google Trend data for all keywords which gave us a lot of great information to tell us keyword velocity (whether it's up or down) and seasonality.
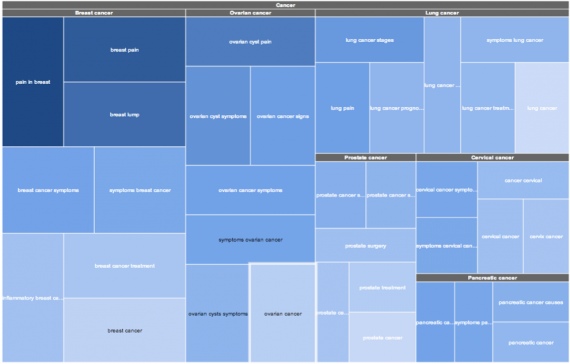
The tree map color and box size (see below) tells us the number of year over year increases from category keywords. We can see breast cancer has the greatest year over year growth from the keywords within that group, followed by ovarian cancer.
Click on the topics to see what keywords had the greatest year-over-year growth. Right click to go back to the default view.
Here is a detailed version of the tree map:
This approach enables us to select the keywords with the greatest year-over-year growth in the tree map to display trends. Below are two winners and two losers to test this theory:
Winners:
Losers:
By showing a tree map in conjunction with a heat map we can spot strong growth very easily and also understand the category sizes.
Competitive Analysis
The next major part to answering the question "what do we publish?" is competition. Which topic areas have little competition and high search volume?
To do this analysis, we pulled historical search results pages going back to 2010 from SEMrush and categorized over 100 domains. We then calculated the amount of traffic each URL receives by SERP, per month, for the last three years using Slingshot's CTR curve.
We are a hospital and there are sites like the NYTimes ranking for our terms so let's see how types of sites rank historically for our topic areas to show how user intent has evolved with search engines over time:
Change the below chart settings to:
Y Axis: avg SV X Axis: count Domain Type in SERPs Color: Sub Category Size: avg CPC
We can see information resources are very prominent in the search results but not receiving comparable traffic. The beauty is we can see where there is a low spend, high search volume term, or groups of terms with low competition for sites like ours.
Every time we review the analysis, there is always something new and unique depending on how you slice and dice the data. Feel free to add some of your insights in the comments below.
When do I publish
my content?

Let's say we go after breast cancer as a topic. When would we publish the content on the topic of breast pain? There is strong year-over-year growth. So when during the next year would be optimal to publish? If we look at every year's peak search month over ten years, we can see peak months for our keywords.
Below is a heat map that shows us if we wanted to publish on the topic of breast cancer, we'd want to do so in October because it has peaked 10 / 10 times during that month.
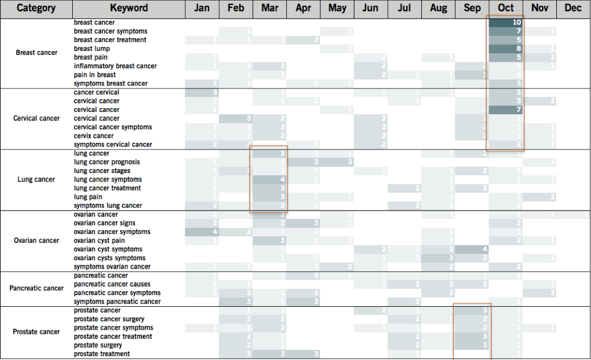
There are certain months where we do not have seasonality. Does that mean we do not publish in certain months? Absolutely not.
You need to stay relevant and one way of doing that is to attached yourself to predictable trends. For instance, we know there is an Oscars ceremony every year, so during the run-up time for the Oscars we can publish content around actors that have cancer. That might not strike deep into the needs of our audience, but it could be a way we can relate to them.
For inspiration, I created a content content calendar for the internet. I pulled monthly data for all Google Trend categories (about 1,500) from January of 2004 to December of 2013 to show the growth strength of each trend and seasonality. See the tree / heat map below; the size of the boxes is the year-over-year growth, and deeper the color, the more seasonal a trend is.
Internet Content Calendar
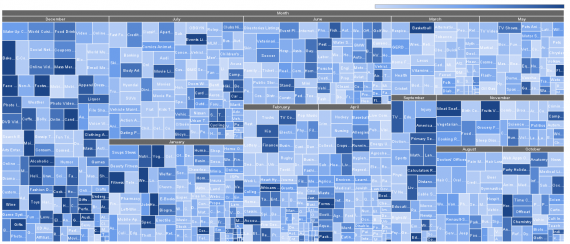
For instance, we can now see that in December we have a content gap, so we can use the internet content calendar to find that baking peaks in December almost every year. We can select the baking category in Google trends then query for cancer and we can see there are keywords around "cancer cookies." Finally, we can publish a post around top 10 cookie gifts for cancer patients.
It's a way to stay relevant regardless of your industry.
What's next?

We've analyzed different ways to find strong growth for seasonal topics over time. There are many other ways to visualize the data in meaningful ways as well as gleaning additional insights from the above visualizations.
Feel free to add some additional insights in the comments below.

