Digital Analytics and Google Chrome
Do you work in digital marketing and use Google Chrome? There’s probably a good chance that you do. Let’s break down why:
- Despite the rise of mobile device usage, desktop still accounts for 43% of all online sessions
- As of May 2017, an estimated 59% of all desktop users use Google Chrome
If we look at digital analysts specifically:
- Surveys have confirmed what most people believe: Google Chrome users tend to be younger, and digital analytics jobs tend to skew towards a younger age group as well
- Digital analysts typically use multiple browsers for testing purposes, so Google Chrome is probably at least one of the browsers that they use
So, you are asking: We get it, Google Chrome is used a lot, and likely at a higher percentage by digital analysts, but why does this matter? Glad you asked!
Google Chrome has add-ons, also known as extensions, which allow you to complete additional tasks in the Chrome browser that previously were more difficult to do. This applies to all areas, but of course for this topic, the most important is digital analytics.
Let’s show how add-ons will be able to help you as a digital analyst. With the below Google Chrome add-ons for digital analytics, you will be able to:
- Quickly troubleshoot analytics tracking issues
- Do easy checks for tracking on websites
- Make your digital analytics job a whole lot easier!
So, let’s get to it. What are these top 5 web analytics tools, and how can they help you?
Top 5 Chrome Analytics Add-Ons
1. Ghostery
What is Ghostery for Google Chrome?
Want to quickly check to see what analytics trackers are on a site? How about additional information such as Advertising tools like Google or Bing Ad tags? Social Media like Facebook or Twitter remarketing? Ghostery is your go-to tool, allowing you to quickly judge what a site is tracking at that very moment.
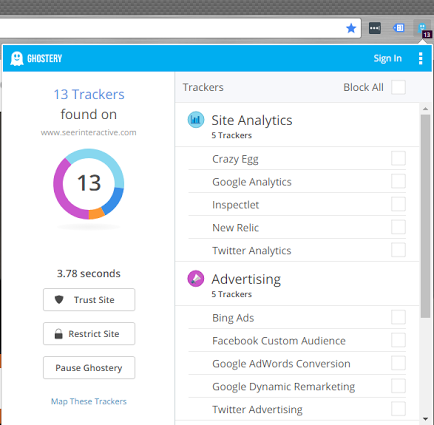
Purpose: Quick checks on total trackers on site, seeing if code is missing.
How to Use: Click the Ghostery extension when you are on the page, and see the results!
Add Ghostery to Chrome
2. Google Tag Assistant
What is Google Tag Assistant for Google Chrome?
Issues with Google Analytics code or Google AdWords conversion codes firing can be frustrating. Want to record your session and see what might be wrong along your path? Worried about potential double tracking of pageviews with multiple Google Analytics codes on page? Google Tag Assistant has you covered.
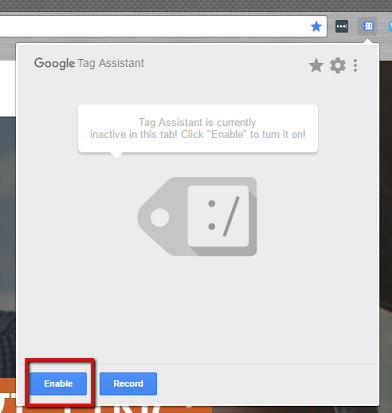
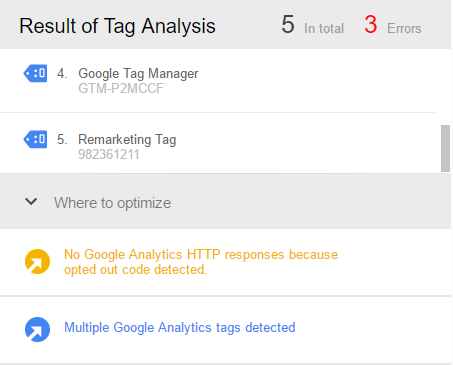
Purpose: Check to see if there are any errors from Google tags, regardless of whether it is Google Analytics on-page, Google Tag Manager, or various AdWords remarketing efforts.
How to Use Google Tag Assistant: Click the Google Tag Assistant extension, hit “Enable”, and refresh the page for results! To record you’ll do the same, and then hit the “record” button to start, and “end recording” to stop.
Add Google Assistant Extension to Chrome
3. ObservePoint Tag Debugger
What is ObservePoint Tag Debugger?
Ghostery is great, but if you are looking for detail, ObservePoint is your tool. What if you want to know every instance of analytics, advertising, tag management, or data management areas on a site? ObservePoint has it. ObservePoint also features more granular information as well, such as the account of each, status, size, and response time. It’s all there, upon a simple refresh in your developer tools.
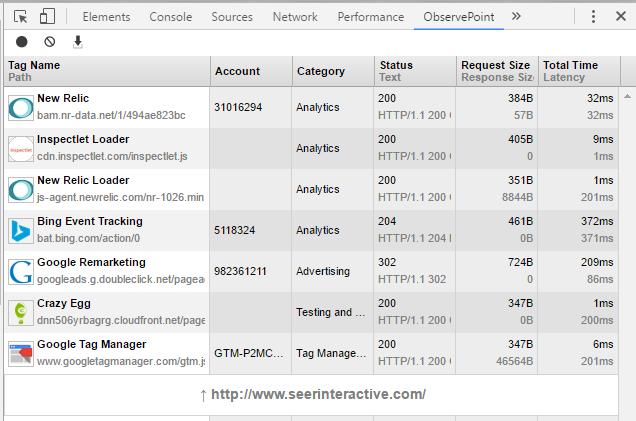
Purpose: A more detailed view of on-site tracking, with some timing details. Good to see if there is duplicate tracking.
How to Use ObservePoint Debugger: Once the extension is installed, right-click, hit “Inspect” (or open the Chrome Dev tools), navigate to ObservePoint, refresh the page, and get results!
Add ObservePoint to Chrome
4. Google Analytics Debugger
What is Google Analytics Debugger?
Analyzing a site with Google Analytics tracking? Do you want another source to verify your data other than Google Analytics real-time or network calls? Want to verify content groupings and/or custom dimensions? That’s where GA Debugger comes in.
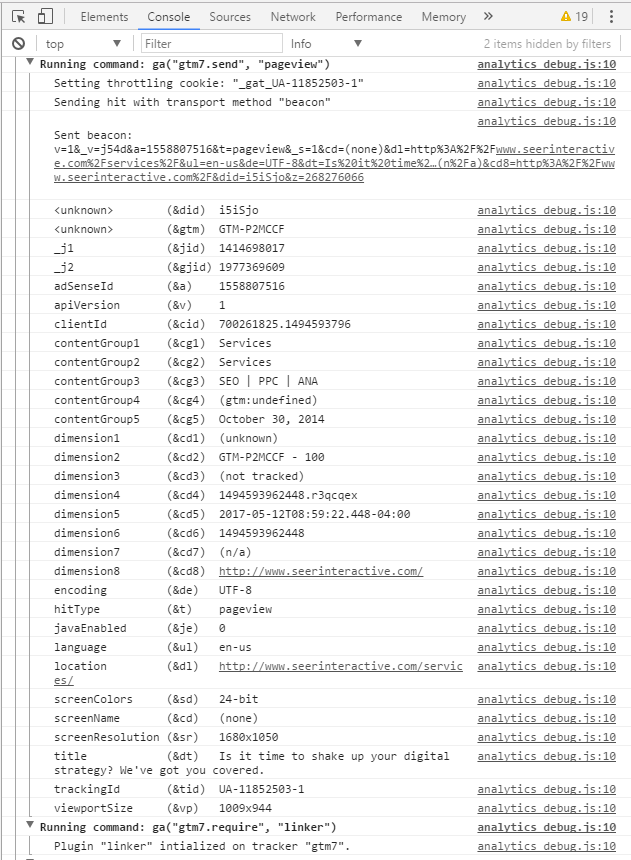
Purpose: Seeing all details from a Google Analytics hit sent.
How to Use Google Analytics Debugger: Right-click, select “Inspect”, hit “Console”, and see the data printed to the console!
Add Google Analytics Debugger to Chrome
Adobe Analytics Debugger
What is Adobe Analytics Debugger?
Same case as the Google Analytics debugger, but for Adobe Analytics. Want to easily find those pesky eVars and sProps from Adobe? Want to know the Report Suite where the data is sent? How about the specific Page Name? Everything in one place!
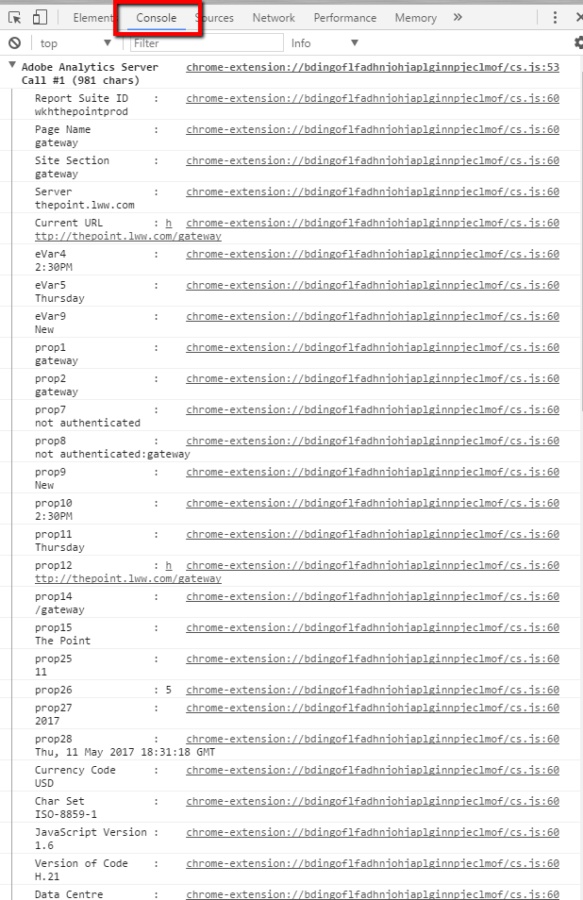
Purpose: Seeing all details from an Adobe Analytics hit sent.
How to Use Adobe Analytics Debugger: Right-click, select “Inspect”, hit “Console”, and see the data printed to the console!
Add Adobe Analytics Debugger to Chrome
Thoughts on Analytics Add-Ons In General
These 5 analytics add-ons for Google Chrome will help you quickly capture the data you need. These extensions are there to help make your analysis more efficient, why not take advantage of them?
Do you have other analytics add-ons that you use that are your favorites? Any feedback on using the above add-ons on your end? Let me know in the comments.
Now, go forth Chrome users, and make your digital analytics jobs easier!

