Although I prefer to use Excel for my data manipulating needs, Sheets in Google Drive has some pretty nifty tricks that give it an advantage for certain tasks. These tips aren't for the super advanced data mavens, rather, they're for the common folk Here's a quick look at four cool Sheets features you might not be familiar with.
1. Google Sets
Depending on when you got into SEO, you may or may not remember Google Sets. It was a little tool in Google Labs where you could plug in a few phrases and see what other phrases Google considered related. It wasn't very robust and Google eventually shut down the project. There is hope for those who mourn the tool's passing. It has (sort of) been resurrected in Google Drive.
How to Use It
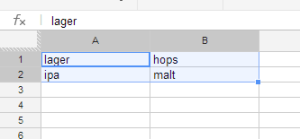
- Type in two phrases, one in cell A1 and one in cell A2.
- Highlight the cells.
- Press and hold "Ctrl" while dragging the little blue box in the bottom right hand corner.
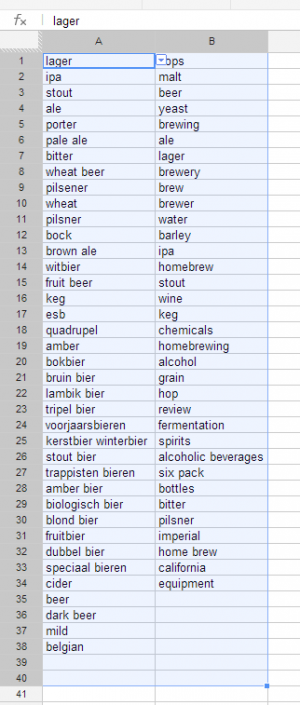
Each set is a different size, so scroll down far enough to fully populate the set. Unfortunately, some phrases don't return any sets.
See It In Action
Say I'm doing keyword research for a client that produces beer. From experience, I'm aware of many different types but want to make sure I'm not leaving anything out. While I'm at it I also want to see different ingredients I may have missed.
Pick your seed words, highlight the words, and press and hold Ctrl while dragging the little blue box
See your sets
Hat tip to Alex Chitu.
2. Charts with Two Y-Axes
Charts can be awesome. They look good and are helpful for those of us who don't read. They're doubly awesome when you chart two things at once. Although two y-axes aren't recommended for all types of data sets, they can be useful.
How to Use It
- Highlight to sets of data you want to chart together
- Click "Insert">"Chart" on the menu
- Select the chart type and click "Insert"
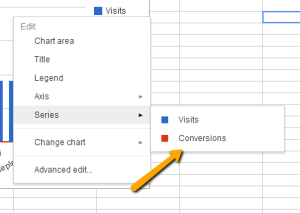
- Right click your new chart and select "Series">"Series you want to move to the right axis" (that's not really what is says, by the way)
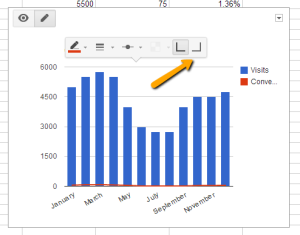
- In the bubble that pops up you'll have the option of selecting between two right triangles which will toggle between the left and right y-axes
See It In Action
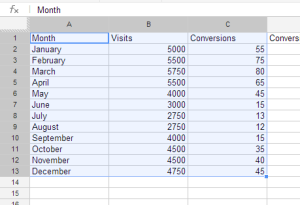
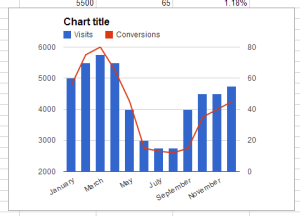
Say we want to chart visits and conversions together, but the scales prevent us from seeing useful correlations. There's a graph for that!
Highlight your traffic and conversion data
Select the Chart Type and Insert the chart
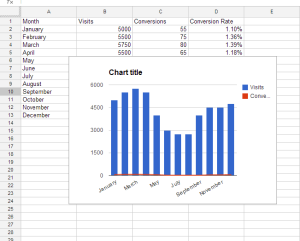
Move the conversions to the right axis
Marvel at your new chart
Check out some of the other cool chart types available (I'm looking at you GeoMap Chart).
3. Scrape HTML
Sheets has an enormous list of formulas and functions, but I really like one in particular: InsertHTML. If you're only a novice scraper, the InsertHTML function will scrape data from a list or table on a webpage and place it into your spreadsheet. This saves you time on copying and pasting...page by page...one by one.
How to Use It
The function looks like this: ImportHtml(URL, query, index)
- URL: the webpage you want to scrape
- Query: is it a "list" or a "table"
- Index: simply the order of the list or table (e.g., "3" would refer to the third list or table on the page)
- Google limits HTML imports to 50 per sheet (copy and paste values to remove the formula but keep the data)
- It might take a few tries to determine the index number for data
See It In Action
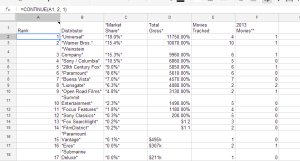
Say I'm building an infographic and looking for box office data. BoxOfficeMojo has lots of data, including market share among studios.
Fill out your formula

Watch the data populate
Hat tip to SEER cohort Ethan Lyon, master scraper.
4. Easily Format Multiple Cells
I'll admit this one might be common sense, but it took a long time for me to realize what the paintbrush is for. Hopefully there's at least one other person out there to validate my paintbrush ignorance. "What's it for?" this one person asks. The answer: formatting multiple cells across different ranges. This is also achieved by copying and pasting the format only, but the paintbrush saves a few mouse clicks.
How to Use It
- Select the cell whose format you want to copy
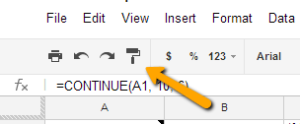
- Click the Paintbrush Icon
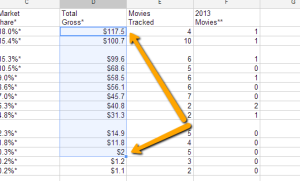
- Highlight any cells you want to copy the format to
See It In Action
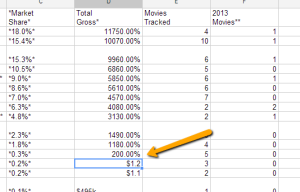
The data from my BoxOfficeMojo import in the last example is a little screwy. It looks like some of the Total Gross numbers imported as percentages instead of dollars.
Highlight the cell whose format you want to copy
Click the paintbrush icon
Drag your cursor over the cells you want to change
What Tips Do You Have?
This list is by no means exhaustive and there are plenty of things to do with custom scripts that I won't get into. What tips do you have to add?


